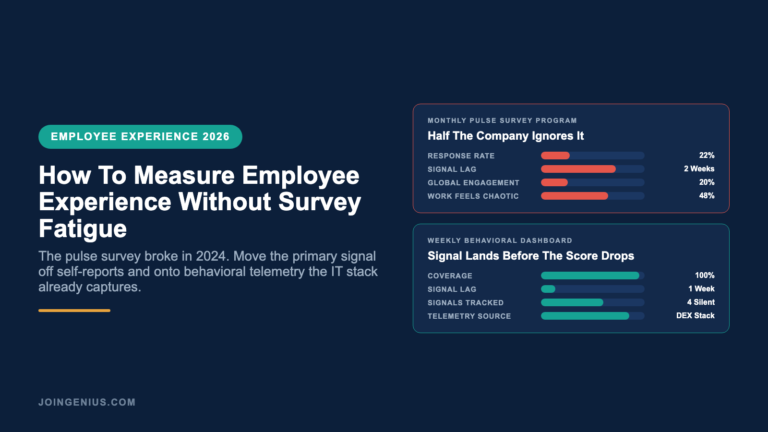
Every HR team that runs quarterly engagement surveys is now asking the same quiet question: how do you measure employee experience across your workforce when nobody wants to fill out another form? Response rates have slipped two quarters in a row at most mid-market companies.
The people who do answer are the ones most likely to say the same thing they said last time. Survey fatigue is real and it compounds.
This post is about what to do instead, which is not “survey less often” and not “survey better.” It is to move the primary signal off self-reports and onto behavior, where the data already exists.
Why The Pulse Survey Stopped Working
The pulse survey was a 2018 invention for a 2018 workforce. It replaced the once-a-year engagement study with a monthly five-question version meant to catch trends sooner. For about four years it worked.
By 2024 the model had broken in three places. First, response rates started collapsing: the same five questions sent to the same list every month trained employees to ignore the invite.
Second, the respondents self-selected toward the quiet middle. The extreme signals of the people about to quit and the people about to get promoted stopped showing up in the data.
Third, the HRBP running the survey no longer had the budget or time to act on the signal fast enough for it to feel worth answering. The loop died from the inside.
The 2026 version of the question is different. HR teams are not asking how to run a better survey. They are asking how to measure the same thing without the survey at all.
Gallup’s State of the Global Workplace 2026 report finds global employee engagement fell to 20 percent in 2025, its lowest level since 2020. The sample ran to 141,444 employed people across 140-plus countries and territories, drawn from fieldwork between January and December 2025.
The pulse survey model is running inside a workforce that is less engaged and more stressed than at any point since the pandemic. HR teams still try to read that reality through a monthly five question form that half the company ignores.
The Three Costs Of Survey Fatigue That Nobody Prices In
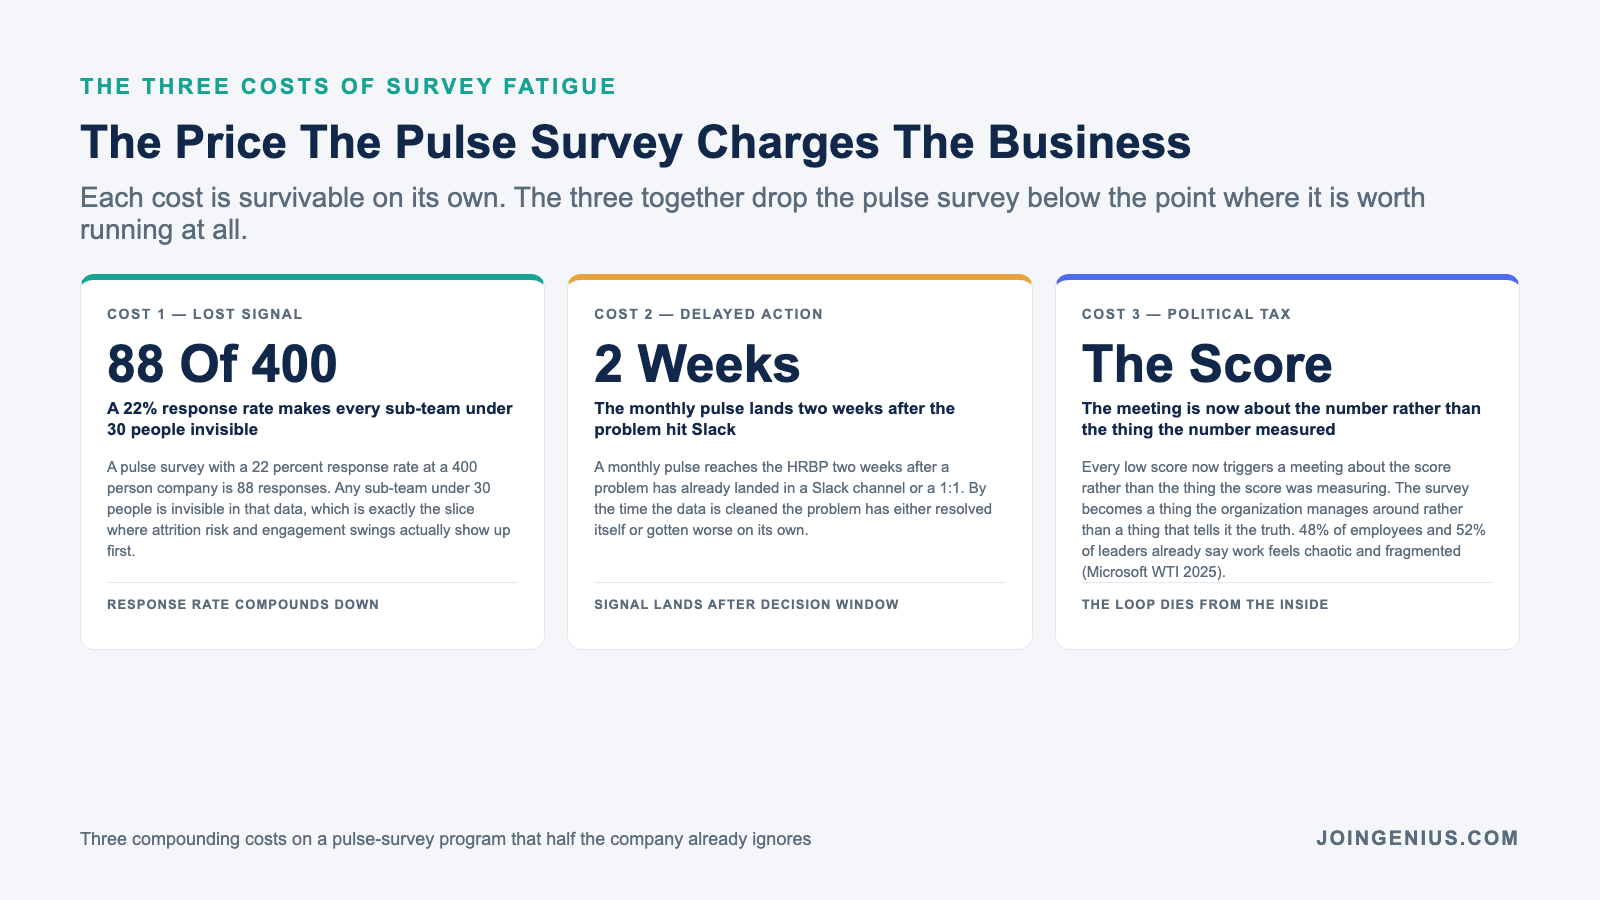
Survey fatigue has a cost line HR teams rarely add up, and it shows up in three places on the business.
Cost one is lost signal. A pulse survey with a 22 percent response rate at a 400 person company is 88 responses. Any sub-team under 30 people is invisible in that data, which is exactly the slice where attrition risk and engagement swings actually show up first.
Cost two is delayed action. A monthly pulse reaches the HRBP two weeks after a problem has already landed in a Slack channel or a 1:1. By the time the data is cleaned the problem has either resolved itself or gotten worse on its own.
Cost three is the political tax. Every low score now triggers a meeting about the score rather than the thing the score was measuring. The survey becomes a thing the organization manages around rather than a thing that tells it the truth.
Microsoft’s 2025 Work Trend Index, published April 23, 2025, adds a fourth cost that HR leaders are already feeling. 48 percent of employees and 52 percent of leaders say their work now feels chaotic and fragmented. The study runs on anonymized Microsoft 365 telemetry plus a survey of 31,000 knowledge workers across 31 countries.
A workforce already running at that level of fragmentation has less room for another feedback request on top of that, which is why response rates are collapsing faster now than at any point in the last five years.
The Real-Time Signal That Replaces The Survey
The alternative to another pulse survey is a real-time DEX analytics layer like ControlUp, which measures employee experience through login times and app launch latency on the actual devices your team uses, so the signal reaches HR before the engagement score drops.
The logic is the one every product team already uses on customers. Customer experience is not measured by asking “how are you feeling about the product” every month. It is measured by crash rate and session length. Those numbers show up live and they explain a drop before the NPS score moves.
Employee experience works the same way. The daily reality of the role is a set of tool interactions: how long it takes to log in, how often the VPN drops, how many minutes the laptop spends on a spinning beach ball.
The same Microsoft 2025 Work Trend Index found the average worker is interrupted every two minutes during the 9 to 5. Factor in activity outside core work hours and that total runs to 275 interruptions a day between meetings and chats. That is behavioral evidence of an EX problem the pulse survey was never designed to catch.
Each one of those numbers is captured already by the IT stack. The question is whether HR has access to it and knows how to read it.
A DEX analytics layer does exactly that translation. It takes the telemetry IT has always had and surfaces it in a format the HRBP can read, in near real time, without asking the employee a single question.
The Behavioral Signals That Beat A 5-Point Scale
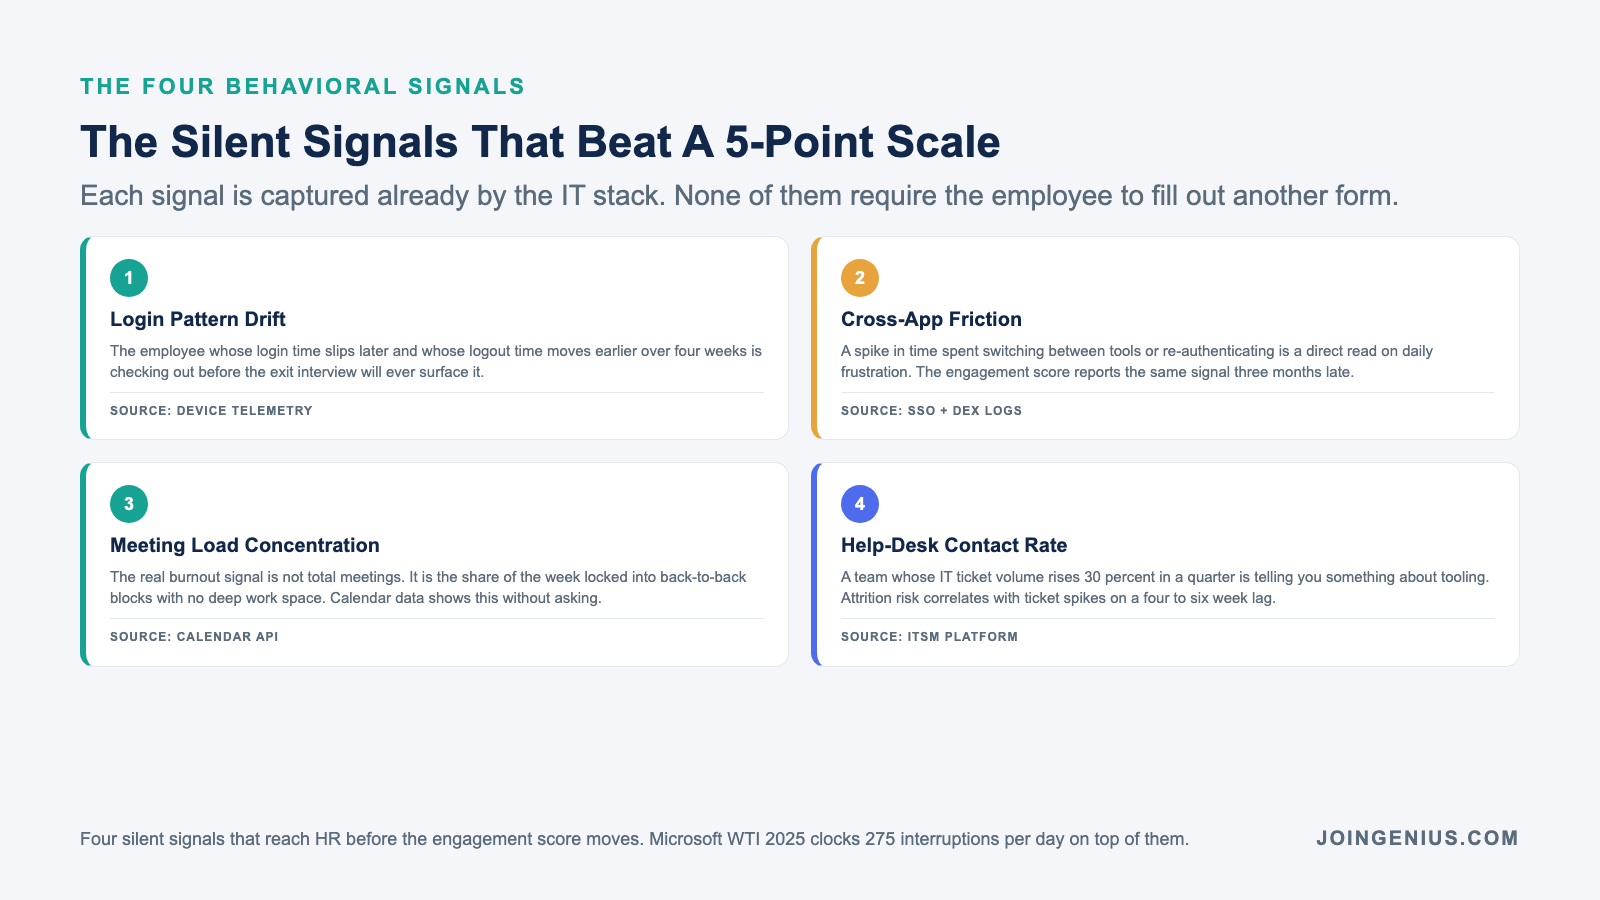
Four behavioral signals are more predictive of engagement and attrition than anything a Likert scale can produce. They are also silent, which means they do not fatigue the people they are measuring.
Signal one is login pattern. An employee whose login time slips later and whose logout time moves earlier over four weeks is checking out before the exit interview. Signal two is cross-application friction. A spike in time spent switching between tools or re-authenticating is a direct read on daily frustration.
Signal three is meeting load concentration. The real burnout signal is not total meetings. It is the share of the week locked into back-to-back blocks with no deep work space. Calendar data shows this without asking.
Signal four is help-desk contact rate. A team whose IT ticket volume rises 30 percent in a quarter is telling you something about tooling that the engagement score will tell you three months later. Attrition risk correlates with ticket spikes on a four to six week lag.
A Weekly EX Dashboard Your HRBP Can Actually Run
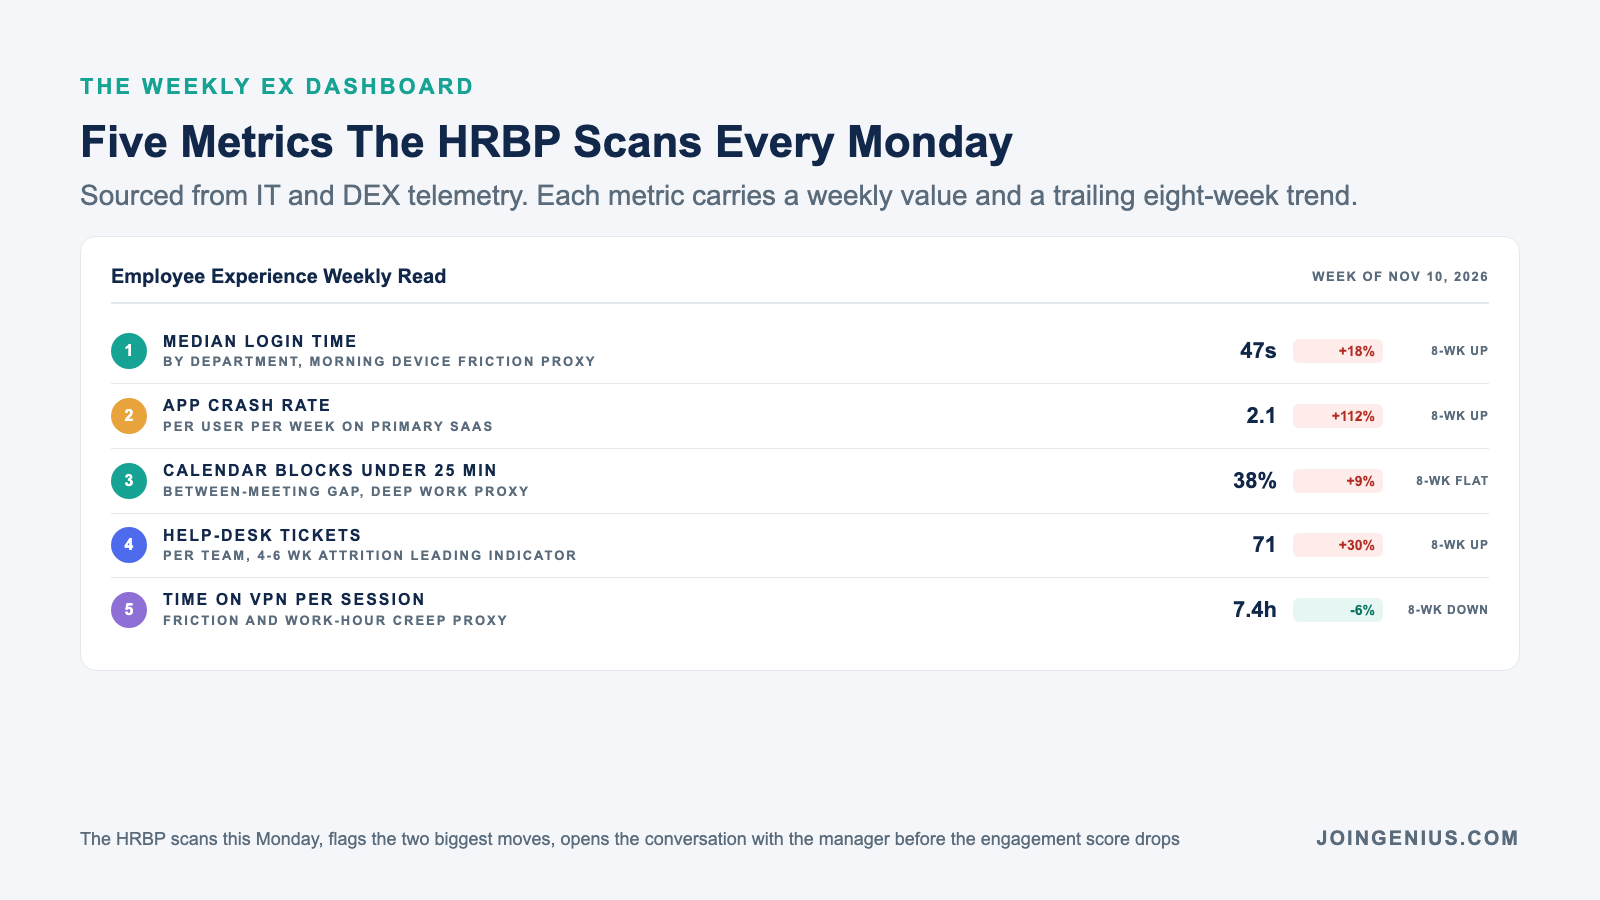
The replacement for the pulse survey is a weekly five metric dashboard owned by HR and sourced from IT and DEX telemetry. The point is to make the signal usable without a data team.
Metric one is median login time by department. Metric two is application crash rate per user per week. Metric three is the share of calendar blocks under 25 minutes between meetings.
Metric four is help-desk ticket volume by team. Metric five is time on VPN per session, which proxies both friction and work hour creep. Each one has a weekly value and a trailing eight week trend.
The HRBP’s job is to scan the dashboard every Monday. Flag the two biggest week-over-week moves and open a conversation with the team manager. The conversation is grounded in behavioral data rather than a scored opinion, which makes it feel more like a product review than a performance review.
The payoff is faster action and less political friction. When a team manager hears “your crash rate on the primary CRM doubled last week” they investigate the tool.
When they hear “your engagement dropped to a 3.2” they get defensive about their management. The first conversation ends with a ticket to IT. The second ends with HR defending the survey.
A behavioral dashboard also surfaces problems the survey never would. A sudden spike in evening VPN sessions on one team is a workload signal.
A 40 percent jump in password resets after a tool migration is a change management failure in progress. The HRBP can bring these findings to the business with confidence because the data was never self-reported.
Pair this with a quarterly open-text pulse (not a scored survey, just one question) and you have replaced the monthly five question form with a system that actually surfaces the problem before the employee answers “disagree.” The conversation skill required of the HRBP changes with it. Build this into your interview rubric for the HRBP role.
Hire HR People Who Can Read The New Signal
The HRBP role is changing with the data. The person who was great at designing a survey and reading a pivot table is not necessarily the person who can read a telemetry dashboard and open a conversation with an engineering manager about app crash rates.
Hiring HR for the 2026 operating model means screening for data literacy and tool fluency and the kind of operational instinct that was previously reserved for product and ops roles. The posting that still asks for “survey design experience” is the posting that will hire the wrong person.
The hiring window is tight. The US Bureau of Labor Statistics counts 939,700 human resources specialist jobs in 2025, with a 6 percent growth projection through 2035 and a median wage of $75,940 as of May 2025, last modified October 29, 2026. That is a seller’s market for the data-literate HRBP archetype you need to hire against.
Genius hires top one percent HR and people operations talent from the Philippines and LATAM at roughly 80 percent less than local comp. There are no monthly fees and the placement comes with a six month replacement guarantee.
We screen against the new signal reading capability on this page before any candidate reaches a hiring manager, so your sourcing funnel brings you HR people built for a dashboard, not a Likert form.