If your survey response rate tanked this year, it is not your copy. It is not the Tuesday you forgot to schedule a reminder. The decline is structural.
Pew Research Center’s 2025 National Reference Survey landed an AAPOR RR1 of 29 percent. The Census Bureau’s 2025 CPS ASEC weighted response rate fell to 62.0 percent, down from 69.0 percent in 2019.
An AAPOR 2025 paper on college students shows institutional response rates sliding from about 42 percent in 2014 to 26 percent in 2024. Those are the best-resourced survey programs on the continent. If their numbers fell that far, the 20-question Google Form your HR team sent out in October was never going to clear 30 percent either.
The fix is not better subject lines. It is a rebuild of the asset itself. The 2025 and 2026 primary data points the way.
The Fatigue Is Real And It Shows Up In The Primary Data
Response rates have been falling for a decade. The last two years took a step change. The Pew Research 2025 reference survey sampled an address-based frame and offered three response modes. It still landed at 29 percent.
That is the ceiling a mixed-mode professional survey can hit in 2025. Not the floor.
Federal surveys tell the same story. The 2025 CPS ASEC release reported a 62.0 percent weighted response rate, seven points below 2019. A Federal Reserve Bank of Atlanta policy brief in April 2026 showed monthly CPS response rates dropping almost five additional points between September and November 2025 during the federal shutdown.
Those monthly rates have not fully recovered. When the biggest labor-market survey in the country loses five points in two months, no internal engagement survey is immune to the same fall.
The pattern is sharper at the edges. The AAPOR 2025 paper by Sarraf and colleagues on NSSE data showed institution-level response rates for U.S. college students falling from a 42 percent average in 2014 to about 26 percent in 2024.
The same paper found that a 20 dollar incentive moved the rate 3 to 5 points. That is useful. It is also not enough to offset a 16-point drop.
The implication for any internal survey owner is simple. Benchmarks printed on a vendor blog in 2021 are no longer the right target. A 45 percent response on an employee pulse is strong in 2026. A 30 percent response is normal. A 15 percent response means the design is broken, not the audience.
Reset the goalposts before the next field goes out. Most dashboards still carry 2019 or 2020 targets as the green line. That guarantees every program looks like it is losing even when it is matching the market.
The ask on the next review is not “why is response lower.” The ask is “what response rate would be an actual signal of program health in this environment.”
What Actually Changed Since 2019
Three things shifted at once. Most survey programs have adapted to one of them.
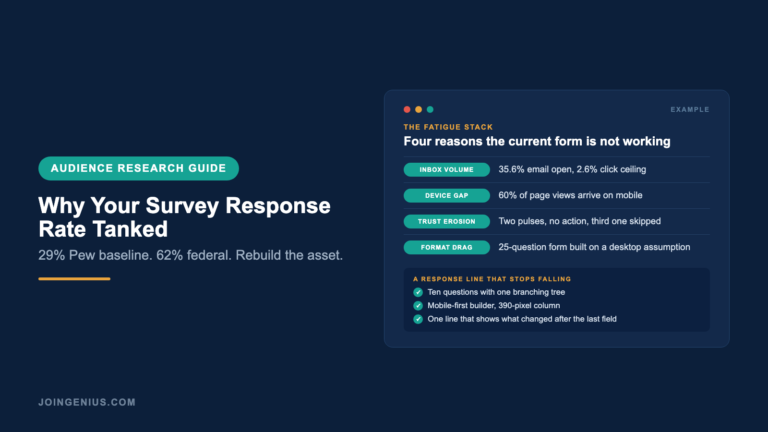
The first is inbox volume. Mailchimp’s global email benchmarks, last refreshed in December 2023 and still published as the live figure, show a 35.63 percent open rate and a 2.62 percent click-through rate across all industries. Those are absolute numbers for the medium you are using to deliver the survey.
If your email list is 2,000 people, your click pool is roughly 52 clicks before anyone even sees the first question. That is the real top of the funnel on an email survey, and it is where most programs over-budget the audience.
The second is device. StatCounter’s October 2026 global reading puts mobile at 59.9 percent of page views and desktop at 38.5 percent. In the United States the split flips to 55.6 percent desktop and 42.2 percent mobile as of August 2026.
A survey that renders on a 390-pixel screen as a scrolling wall of radio buttons loses the respondent before question three. The desktop preview looks fine. The thumb test on the live link does not.
The third is trust. The Atlanta Fed brief from April 2026 is the cleanest read on this effect. When federal agencies went dark during the shutdown, response rates fell faster than survey volume did.
People stopped answering because they stopped believing the asker would do anything with it. That same signal drives the slow bleed on internal engagement surveys. Employees who answered two pulses and saw no action simply close the tab when the third one arrives.
The Mobile Gap Most Forms Still Have Not Closed
The Pew Research Mobile Fact Sheet reports 91 percent of U.S. adults own a smartphone as of 2025. The share of a 5,000-person Pew mixed-mode survey that chose the web mode was 2,349 out of 5,022. Another 2,331 chose paper. Only 342 chose phone.
The takeaway is not that paper is back. It is that even when Pew offered a professional-grade web experience alongside mail and phone, nearly half of respondents still picked something other than a web form.
Part of the reason: most internal survey tools are built on a desktop assumption and bolt mobile on afterward. The question stack is long. The layout breaks at 390 pixels. The progress bar lies.
If you cannot answer the question “what does question seven look like on an iPhone 15” in five seconds, you are losing respondents at question seven.
Four Fixes That Actually Move The Response Rate
Each of these is low-cost. Each one maps to a specific drop-off point in the funnel.
Cut the question count. The AAPOR college-student data showed that even small structural changes to the instrument moved response rates measurably. Every question after fifteen roughly halves the chance a respondent finishes.
A ten-question survey with one branching logic tree outperforms a 25-question survey that asks everything in sight.
Pick one channel and own it. If email opens are 35 percent and clicks are 2.6 percent, do not also send the same link over Slack and expect additive lift. You get fractional lift and a reputation for spamming three channels at once.
Choose the channel with the highest baseline engagement for the specific audience. Reinforce it with one reminder on day three. That is the whole protocol.
Build the asset mobile first. Design in a 390-pixel column. One question per screen. Thumb reach on the primary action. If it reads well on a phone, it reads fine on a laptop. The inverse is not true.
Show the respondent what you did with the last one. The Atlanta Fed trust finding is the quietest lever and the most under-used. A single line at the top of the email (“Here is what changed after the September survey”) moves response rates more reliably than a ten-dollar gift card.
The cost is zero. The requirement is that you actually did something after the last survey.
What An Interactive Format Changes About The Math
The format of the asset itself is the single biggest driver most survey owners never touch. The Content Marketing Institute’s 2025 B2B Content Marketing Benchmarks, fielded between June and August 2024 with a sample of 980 B2B respondents, reported that only 27 percent of B2B marketers used interactive content at all.
The enterprise subset was 34 percent. In a channel that saturated, switching from a static form to a conversational or quiz-style asset is still a real differentiator.
A platform like OpinionStage is built for exactly this shift. It is the quiz-and-poll maker that teams also use for surveys because the format carries over. The homepage reports 80 percent of people who see an interactive poll or quiz in their feed click on it.
Platform scale is 20 million leads captured and a 4.8 out of 5 G2 rating across 111 reviews. A named customer (Kari Gilbert at IHG Hotels and Resorts) quotes a near-50 percent increase in feedback submitted after switching to the format.
The product feature list reads like a direct response to the fatigue problem. Skip logic branches the instrument so respondents only see questions that apply to them. Answer piping personalizes the next question based on the last one.
The builder is mobile-first by default, not retrofitted. And an AI prompt turns a brief into a working survey in under a minute, which collapses the build time that usually eats the first three days of the project.
Not every feedback program needs to become a quiz. But the gap between a 29 percent Pew baseline and the 80 percent click-rate that OpinionStage reports on interactive formats is big enough to be worth testing on the next field.
The One Question To Answer Before You Field The Next One
Before the next survey goes out, answer this question. What will change if the response rate is 15 percent, and what will change if it is 55 percent. If the answer is the same in both cases, the survey was never load-bearing. The response rate does not matter. Kill the field and reclaim the calendar.
If the answer is different, response rate is the only number that matters. The four fixes above are the cheapest available before you touch the budget. Fewer questions. One channel. Mobile first. Closed loop.
The format swap to an interactive builder is the biggest lever if the first four are not enough. Either way, the question is no longer “how do we get more responses on the current asset.” The question is whether the current asset is the right one.
The 2025 and 2026 primary data says most of them are not.