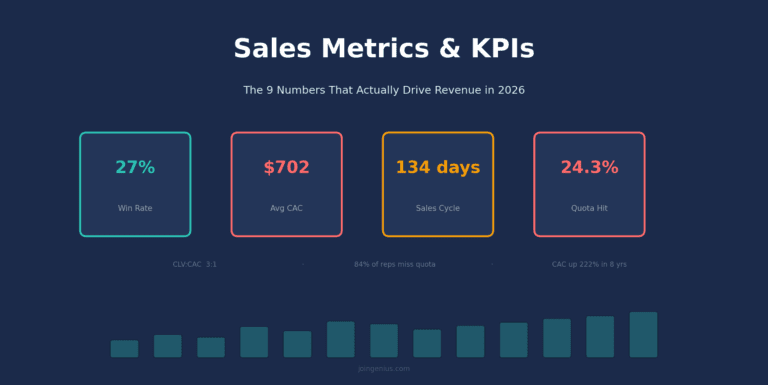
84% of sales reps missed quota last year. And most of them had dashboards packed with data.
The problem isn’t a lack of numbers. It’s tracking the wrong ones. Teams drown in activity metrics while the KPIs that actually predict revenue sit buried in spreadsheet tabs nobody opens.
This guide breaks down the 9 sales metrics and KPIs worth your attention. You’ll get the formulas, the benchmarks, and a review cadence that turns data into decisions.
Why Most Sales Teams Track the Wrong Numbers
69% of B2B sales reps missed quota in 2024. Dashboards multiplied. Wins didn’t.
The 80/20 rule applies here. Roughly 20% of your sales performance metrics explain 80% of your results. The rest? Noise.
The real issue is that teams lean too heavily on lagging indicators. Revenue, closed deals, total bookings. These tell you what already happened. By the time you see a problem, it’s too late to fix it.
High-performing sales teams keep a 60/40 balance. 60% leading indicators (calls, meetings, pipeline adds) to act in real time. 40% lagging indicators (win rate, revenue, CAC) to validate outcomes.
Sales Metrics vs. KPIs: What’s the Difference?
These terms get used interchangeably. They shouldn’t.
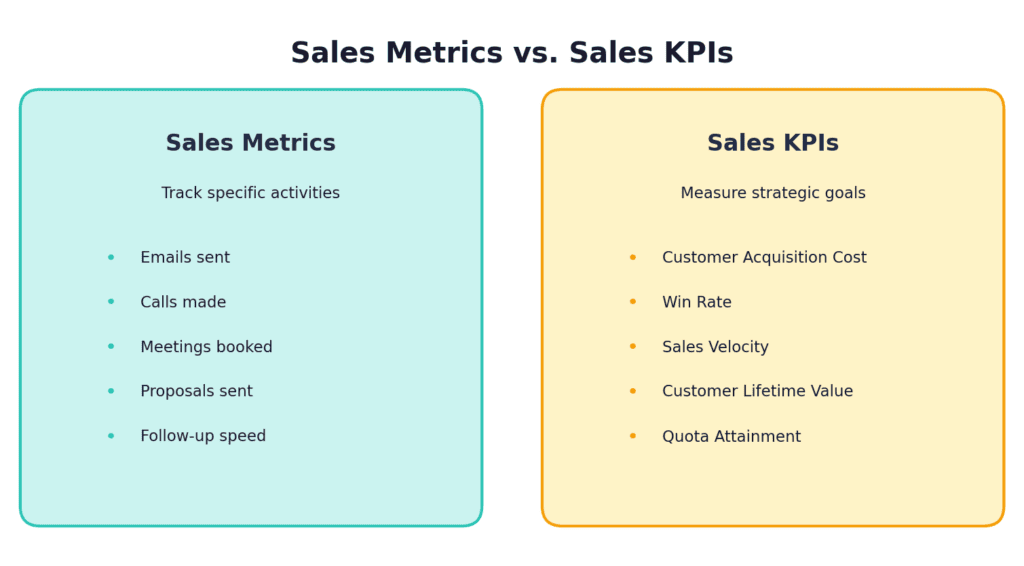
Sales metrics track specific activities. Emails sent, calls made, meetings booked, proposals delivered. They give you a broad overview of what’s happening inside your sales team.
Sales KPIs are targeted metrics tied directly to strategic business goals. They tell you whether you’re on track to hit your revenue targets. Customer acquisition cost, win rate, sales velocity. These are the numbers your leadership team watches.
Here’s a simple way to think about it. If a metric doesn’t trigger a decision or coaching action, it doesn’t belong on your main dashboard.
📌 Key Takeaway
Not every metric deserves a widget. Focus on the sales KPIs to track that directly connect to revenue outcomes. If a number doesn’t change what you do next, stop watching it.
9 Sales KPIs Worth Tracking in 2026
These are the key performance indicators that separate teams hitting targets from teams staring at dashboards wondering what went wrong. Each one includes the formula, current benchmarks, and why it matters.
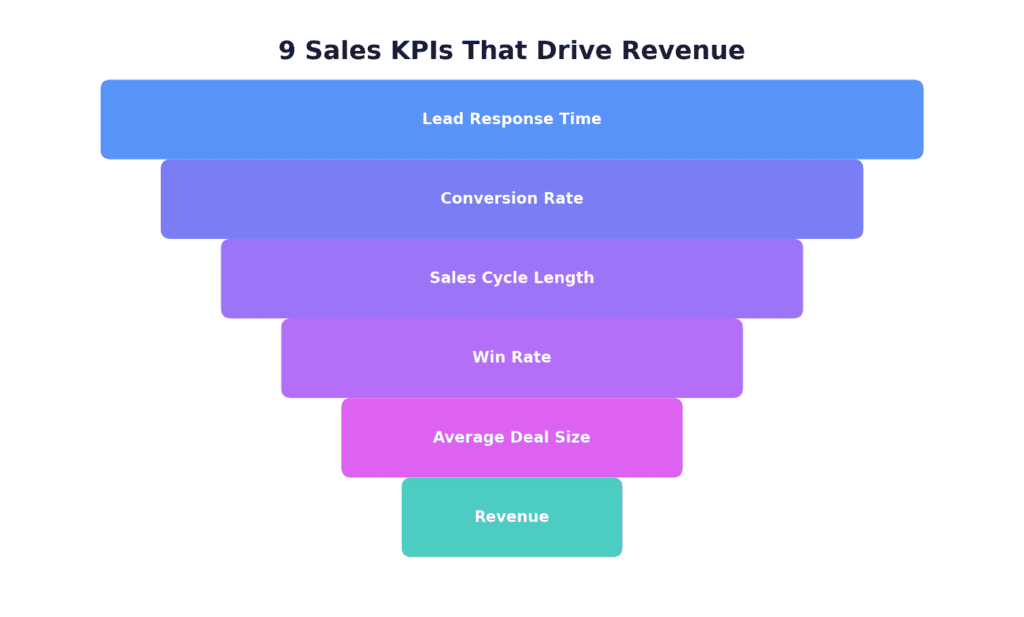
1. Lead Response Time
How quickly your reps respond to inbound leads is one of the strongest predictors of conversion. Up to 50% of sales go to the first vendor that responds.
Formula: Time between lead submission and first sales contact
Benchmark: Under 5 minutes for inbound leads. Most teams average 42 hours. That’s not a typo.
They move from your site to a competitor’s. They get distracted. They forget why they filled out the form. If your team isn’t using the right talent sourcing tools to respond fast, you’re leaving money on the table.
2. Lead-to-Customer Conversion Rate
Your conversion rate tells you how efficiently your sales pipeline turns prospects into paying customers. It’s the clearest signal of whether your qualification and closing processes actually work.
Formula: (Number of new customers / Number of leads) × 100
Benchmark: The average B2B close rate sits around 2-5%, depending on industry. Top-performing teams push above 7%.
If your rate is below average, the bottleneck is usually in one of 3 places. Poor lead quality coming in. Weak discovery calls. Or a talent acquisition process that’s bringing in the wrong salespeople.
💡 Quick Tip
Track conversion rate by channel, not just overall. You might find that referrals convert at 15% while cold outbound converts at 1%. That one insight can reshape your entire budget allocation.
3. Sales Cycle Length
This measures the average number of days from first contact to closed deal. It directly impacts your cash flow and forecasting accuracy.
Formula: Total days to close all deals / Number of deals closed
Benchmark: The average B2B SaaS sales cycle now runs 134 days, up from 107 just a year earlier.
Longer cycles mean higher cost per deal. They also mean more deals stalling in your pipeline. If your cycle is getting longer each quarter, dig into where deals are getting stuck. Is it the demo-to-proposal gap? The legal review? Stakeholder alignment?
4. Win Rate
Win rate is the most direct measure of your team’s sales effectiveness. It shows you what percentage of qualified opportunities actually become customers.
Formula: (Deals won / Total deals closed, including lost) × 100
Benchmark: Average B2B win rates range from 20-30%. Top performers hit 35%+.
A consistently high win rate signals strong competitive positioning and an effective sales process. A declining win rate is an early warning sign that something fundamental has shifted. Maybe competitors improved. Maybe your messaging is stale. Maybe your reps need better delegation examples to focus on selling instead of admin work.
📊 By the Numbers
Only 24.3% of salespeople exceed their yearly quota. But reps who “always” put the buyer first hit quota at rates 72% higher than those who don’t.
5. Average Deal Size
Average deal size tells you whether your team is moving upmarket, holding steady, or slowly drifting toward smaller, less profitable deals.
Formula: Total revenue from closed deals / Number of closed deals
Benchmark: Varies dramatically by industry. The important thing is tracking your trend over time.
A 10% increase in average deal size, with everything else equal, means 10% more revenue per rep. Teams focused on building effective talent acquisition strategies often see deal sizes grow as they attract higher-caliber closers.
6. Customer Acquisition Cost (CAC)
CAC tells you the total price tag of winning a new customer. It’s the metric that determines whether your growth is sustainable or burning cash.
Formula: Total sales and marketing spend / Number of new customers acquired
Benchmark: The average SaaS CAC is $702 B2B companies average $536. Enterprise deals can exceed $1,200 per customer
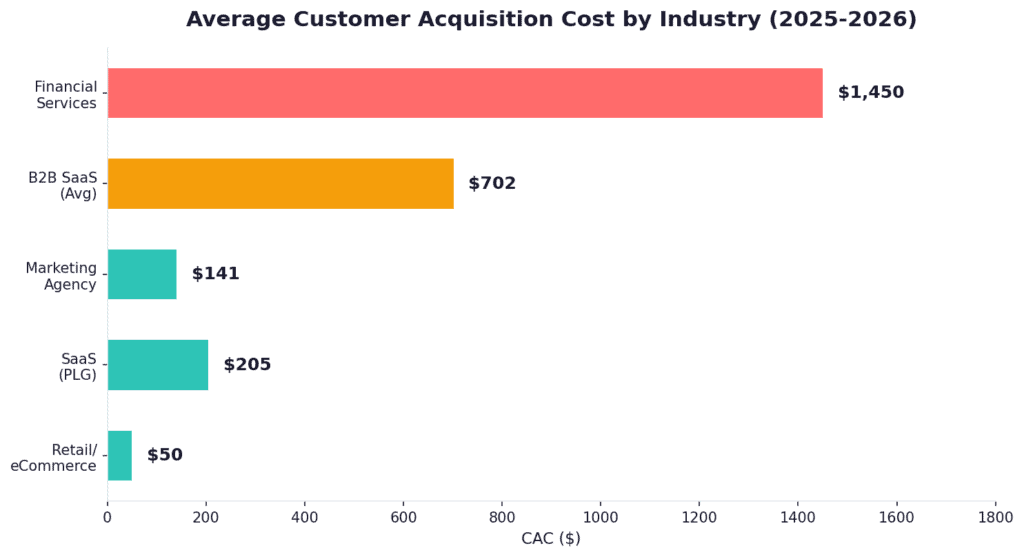
Here’s the uncomfortable truth. Customer acquisition costs have surged 222% over the past 8 years. If your CAC is climbing, you’re not alone. But you do need to fix it.
The standard health check is your LTV:CAC ratio. You want at least 3:1. That means every dollar spent acquiring a customer should generate 3 dollars in lifetime value. Below that, you’re in trouble.
Companies that outsource certain business processes often reduce CAC significantly by lowering overhead costs while maintaining sales quality.
| Industry | Average CAC | Healthy LTV:CAC Ratio |
| Retail / eCommerce | $50 | 3:1 or higher |
| SaaS (PLG) | $205 | 3:1 |
| B2B SaaS (Average) | $702 | 3:1 |
| Financial Services | $1,450 | 4:1 |
| Enterprise Software | $1,200+ | 3:1 |
⚠️ Common Mistake
Calculating CAC without including all costs. Your formula needs to cover salaries, commissions, tools, advertising, content production, and overhead. Most teams undercount by 30-40% because they only include ad spend.
7. Customer Lifetime Value (CLV)
CLV measures the total revenue you can expect from a single customer over the entire relationship. Without this number, you’re flying blind on how much you can afford to spend on acquisition.
Formula: Average revenue per account × Average customer lifespan (in months or years)
Benchmark: A healthy SaaS company maintains a CLV that’s at least 3× its CAC. Top performers hit 5:1.
This is where retention becomes a revenue strategy. Reducing churn by just 5% can increase profits by 25-95%. That’s not a rounding error. It’s the difference between growth and stagnation.
If your CLV is declining, look at onboarding quality, support response times, and product engagement. These are the leading indicators of churn. For SaaS companies, security incidents tank CLV fast.
Teams investing in talent acquisition and retention see downstream improvements in every customer-facing metric.
8. Quota Attainment Rate
Quota attainment measures how effectively your reps and team hit their assigned targets. It’s the scoreboard metric that rolls up everything else.
Formula: (Revenue from closed deals / Sales quota) × 100
Benchmark: A good quota attainment rate falls between 60-80% of reps hitting target. 84% of reps missed quota entirely last year.
But here’s the part most people miss.
Low attainment across the entire team usually isn’t a people problem. It’s a quota-setting problem. If fewer than 50% of your reps hit quota consistently, you likely have unrealistic targets, misaligned compensation, or a broken sales process.
Track this metric at both the individual and team level. Individual attainment helps you coach specific reps. Team attainment tells you whether your hiring strategy needs an overhaul.
9. Sales Velocity
Sales velocity is the master KPI. It combines 4 metrics into a single number that tells you how fast you’re generating revenue.
Formula: (Number of opportunities × Average deal size × Win rate) / Sales cycle length

This is powerful because it shows you exactly which lever to pull. You can increase velocity by:
- Adding more qualified opportunities to your pipeline
- Growing your average deal size through upsells or pricing changes
- Improving win rate with better discovery and demos
- Shortening sales cycle length by removing bottlenecks
Even a 10% improvement in any single variable moves the needle. Improve 2 variables by 10% and the compounding effect is significant.
🎯 Pro Insight
Don’t try to improve all 4 velocity variables at once. Pick the one where you’re weakest compared to industry benchmarks. Fix that first. Then move to the next. This approach delivers faster results than spreading effort thin.
Build a KPI Dashboard That People Actually Use
Most sales dashboards fail because they try to show everything. The best ones show only what drives the next decision.
Different roles need different views of your sales team performance data. A rep doesn’t need to see CAC trends. Your VP doesn’t need to see individual call counts. Here’s how to structure it:
| Dashboard | Who Uses It | What It Shows | Review Cadence |
| Rep Dashboard | Individual sellers | Activities, pipeline, quota progress | Daily |
| Manager Dashboard | Team leads | Team win rate, pipeline coverage, coaching gaps | Weekly |
| Executive Dashboard | VP/C-suite | Revenue, CAC, CLV, sales forecasting accuracy | Monthly |
Pipeline coverage ratio deserves special attention. It tells you whether you have enough in the pipeline to hit your number. The standard benchmark is 3× pipeline coverage. If your team needs to close $1M this quarter, you need $3M in active pipeline.
If your team relies on talent acquisition analytics for hiring decisions, apply the same data-driven thinking to your sales dashboard. The principle is identical. Track what predicts outcomes, not what already happened.
For SaaS companies, add monthly recurring revenue (MRR) and net revenue retention to your executive view. These show whether your existing customer base is growing or shrinking, independent of new sales.
How to Review Your KPIs Without Wasting Time
Tracking KPIs is pointless if nobody acts on them. The cadence is what makes dashboards work for sales process optimization.

Daily (5 minutes): Activity metrics. How many calls, emails, and meetings happened yesterday? Flag exceptions. This takes 5 minutes during standup.
Weekly (30 minutes): Performance metrics. Inspect the pipeline. Review win rate trends. Coach specific deals using real conversation data. This is where managers earn their salary.
Monthly (60 minutes): Strategic metrics. Look at CAC, CLV, pipeline coverage, and revenue growth trends. Compare actuals to forecasts. Adjust strategy if the numbers don’t match your plan.
Quarterly: Step back and ask the hard question. Are these still the right KPIs for your business? Markets shift. Products evolve. Your talent acquisition management priorities change. Your metrics should change with them.
💡 Quick Tip
Assign a KPI owner for every metric. Not someone who watches it. Someone who’s accountable for improving it. Unowned metrics always decay.
3 Mistakes That Make Your Sales Data Useless
Even teams that track the right sales metrics can sabotage themselves with bad habits.
Mistake 1: Tracking too many metrics. Research shows that tracking 20+ metrics dilutes coaching time and slows decision-making. Stick to 12-15 maximum. If a metric doesn’t change a behavior, cut it.
Mistake 2: Ignoring leading indicators. Revenue tells you what happened last month. Activity metrics tell you what’s going to happen next month.
Teams that only watch lagging indicators are always reacting, never anticipating.
Mistake 3: Setting it and forgetting it. Your KPIs aren’t permanent. A startup tracking outsourcing cost savings as a primary metric might need to shift focus entirely after scaling past 50 employees. Review your metric framework quarterly.
Companies that use data-driven strategies in their talent acquisition tools consistently outperform competitors running on gut instinct. By 2026, 65% of B2B sales organizations using data-driven approaches will outpace those that don’t.
What To Do Next
Start with sales velocity. It’s the single KPI that forces you to think about all 4 levers at once. Calculate yours today using last quarter’s data.
Then pick one lever. The one where you’re weakest. Spend the next 90 days improving it by 10%. Measure every 2 weeks.
The teams that win in 2026 aren’t the ones with the prettiest dashboards. They’re the ones that track fewer numbers, review them consistently, and actually change what they do based on what the data says.
Revenue growth doesn’t come from more data. It comes from better decisions.