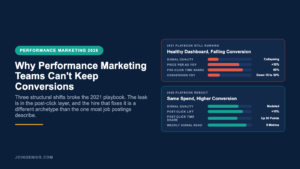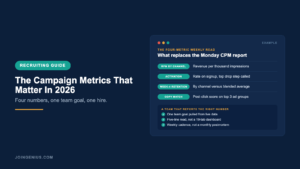
Every B2B marketing team I talk to in 2026 runs a Monday dashboard that looks healthy while revenue misses plan, and that gap is where most teams lose the year. This piece covers the four campaign metrics that matter in 2026 and the single hire who forces the team to stop reporting on anything else.
CPM is down. CPC is flat. Impressions climb every week. And the CFO still asks why pipeline missed by a quarter of the number.
The structural numbers behind the shift are not subtle. Meta’s Q3 2026 SEC filing reports that the average price per ad across its Family of Apps climbed 14 percent year over year while impressions only rose 10 percent. That is a shift from volume to price on the largest paid channel in B2C and B2B.
The channel-level CPM chart does not tell you that story. The revenue chart does. Every quarter that passes without the revenue chart on the Monday review is a quarter the team is operating with the wrong instrument.
Why The Dashboard Looks Fine But Revenue Misses
Three things broke the old dashboard at once. Paid media got more expensive at the auction level. The checkout funnel stayed broken. And the measurement stack fragmented so thoroughly that every tool reports a different number for the same conversion.
The cart abandonment piece is the one most teams underweight. Baymard’s 2025 benchmark aggregate puts the average documented cart abandonment rate at 70.22 percent across 50 studies, a number that has barely moved in a decade. Every paid click lands against that wall.
The measurement fragmentation piece is newer. A mid-market team in 2026 usually has seventeen marketing tools under contract. Each reports conversions with a different attribution window. The result is that the same campaign can show a 3x ROAS in one tab and a 0.8x ROAS in another, in the same hour.
The combined effect is a dashboard that measures spending efficiency on the channel side while the downstream funnel is bleeding. CPM going down looks like a win right up to the point you notice that revenue per impression went down faster.
A 2026 paid team can be running the cleanest ad account the company has ever had and still miss plan. The metric it reports on is simply not the one revenue responds to. The fix is not more tools. The fix is a shorter list of metrics, reported against one team goal, with the same number appearing in every room.
Four Campaign Metrics That Actually Move Revenue
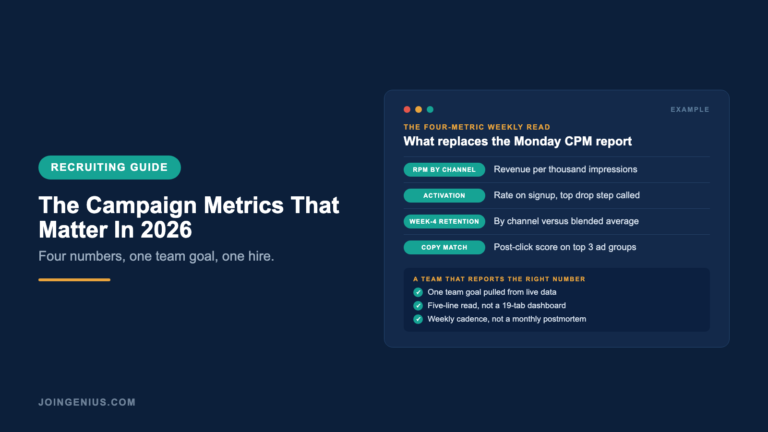
The first is revenue per thousand impressions, not cost per thousand. CPM is a bidding efficiency number. RPM is an audience value number. The two can move in opposite directions in the same week. Teams that only report CPM miss the moment when audience value collapses even though the bid is cleaner than ever.
The second is activation rate on the signup funnel. Every click that lands in your product and does not reach the activation moment is a hidden line item in CAC that nobody allocates. Teams that track activation per paid channel find that two channels of the five are quietly carrying the rest.
The third is week-four retention cohort by acquisition channel. Paid channels that convert to retention weaker than blended average are destroying LTV even when first-click CAC looks fine. The common pattern is a channel that wins on day one and collapses by day thirty.
The fourth is the post-click copy match score. It is the brutal test of whether the landing page says what the ad promised. Teams that score it weekly fix the leak before the quarter ends. Teams that do not, read the postmortem at QBR.
The Goal Layer Where The Metrics Finally Connect
The reason most teams cannot report on these four is not that the numbers are hard to find. The numbers live inside Google Analytics and the ad accounts themselves, with product data in HubSpot or Search Console filling the gaps. What is hard is connecting them to one team goal that the CFO and the CMO agree on.
Teams running a growth-ops platform that plans and measures each campaign against a single team goal pulled from live data close the dashboard-to-revenue gap in the only way that scales past five concurrent campaigns. The argument then moves from which metric is right to which campaign moved the goal.
The alternative is a BI engineer stitching the same four numbers into a weekly report by hand. That works until the team runs five campaigns in parallel across three channels. After that, the stitching takes longer than the campaigns themselves.
A platform that connects to the fifty tools the team already uses, and that measures against one goal rather than fifty, replaces most of the stitching work. It also replaces most of the Monday meetings about which number is the real number, since everyone is reading the same one.
The goal layer is also what makes the four metrics defensible in an executive review. A growth operator who can show one goal, four metrics, and one cause is a different hire from one who shows a channel dashboard with twenty tiles and no narrative.
What To Hire For
The 2026 hire for this job is not a reporting analyst. The BLS Occupational Outlook Handbook counts 454,800 marketing manager jobs in the US under its advertising and promotions category, with a median wage of $165,780 and 6 percent growth projected through 2035. That is the title that reads to recruiting.
What you actually need is a growth operator who thinks in funnel math and runs the four-metric report themselves. The core screen for that person is funnel sensitivity. Give the candidate a hypothetical account at a $75 CPM and 2 percent landing-page conversion.
Ask them to sketch how a 10 percent lift on the post-click side changes CAC. If they reach for a spreadsheet, they are a reporting analyst. If they answer in their head with the right order of magnitude, they are a growth operator.
The second screen is tool fluency. Ask which three tools in a modern stack they would consolidate first if they joined on Monday. A real operator names them in under a minute and explains why each one is redundant with another.
The third screen is the goal screen. Put them in front of a campaign brief with three stated objectives and ask which one is the real one. If they pick without pushing back, they will manage a team that reports on the wrong thing.
The interview loop should spend most of its time on these three screens, not on resume credentials. A candidate who passes funnel sensitivity and tool fluency and then clears the goal screen is a hire. Everything else is a reference check.
A Weekly Dashboard That Replaces Nineteen Tabs
The dashboard that replaces the Monday CPM report has one page and five lines. Revenue per thousand impressions by channel with last week delta. Activation rate on the signup funnel with the top drop step called out. Week-four retention by acquisition channel versus blended average.
The fourth line is post-click copy match score on the three highest-spend ad groups. The fifth is CAC payback period over the trailing thirty days. That is the full list. It fits on one screen. It can be read in under two minutes by anyone in the room.
And it is the only list that answers the CFO’s question about why pipeline missed when the ad dashboards looked fine. Everything else is channel-level diagnostics that belongs in the growth operator’s day, not the executive review.
The weekly cadence matters as much as the five lines. A monthly version of this report is a postmortem. A weekly version is a steering wheel. Teams that move from monthly to weekly on this list find a two-week pullforward on every campaign correction they make.
Hire Growth Operators Who Measure What Matters
The structural shift is not going to reverse. Paid media will keep getting more expensive at the auction. Cart abandonment will keep hovering above 70 percent at the funnel. The measurement stack will keep fragmenting at the tool layer.
The teams that keep plan are the ones that stop reporting on vanity channel metrics and start reporting on the four numbers above, against one team goal. The ones that do not will spend 2027 re-explaining to the board why the dashboard looked fine while pipeline missed.
If you are rebuilding the marketing org around that thesis, sourcing the right growth operator matters more than the tool choice itself. And retaining that operator past the twelve-month mark is what compounds a measurement culture that outlasts any single platform.
The first hire sets the metric list. The second confirms it. By the third hire, the whole team reads the same dashboard on Monday morning, and the CFO stops asking why pipeline missed when the channel view looked clean.