Every performance marketing lead knows the pattern. The ad accounts look healthy and the creative calendar is on schedule, yet performance marketing teams can’t keep conversion in 2026 the way they could inside the 2021 talent pool.
The reason is not a bad hire or a lazy agency. It is three structural shifts that happened at once, and the hire your team needs to fix them is a different archetype than the one most job postings still describe.
This post walks through the three shifts, the quiet place in the funnel where most of the loss actually happens, and what to hire for in 2026 to stop the bleeding.
The Three Shifts That Broke Performance Marketing In 2026
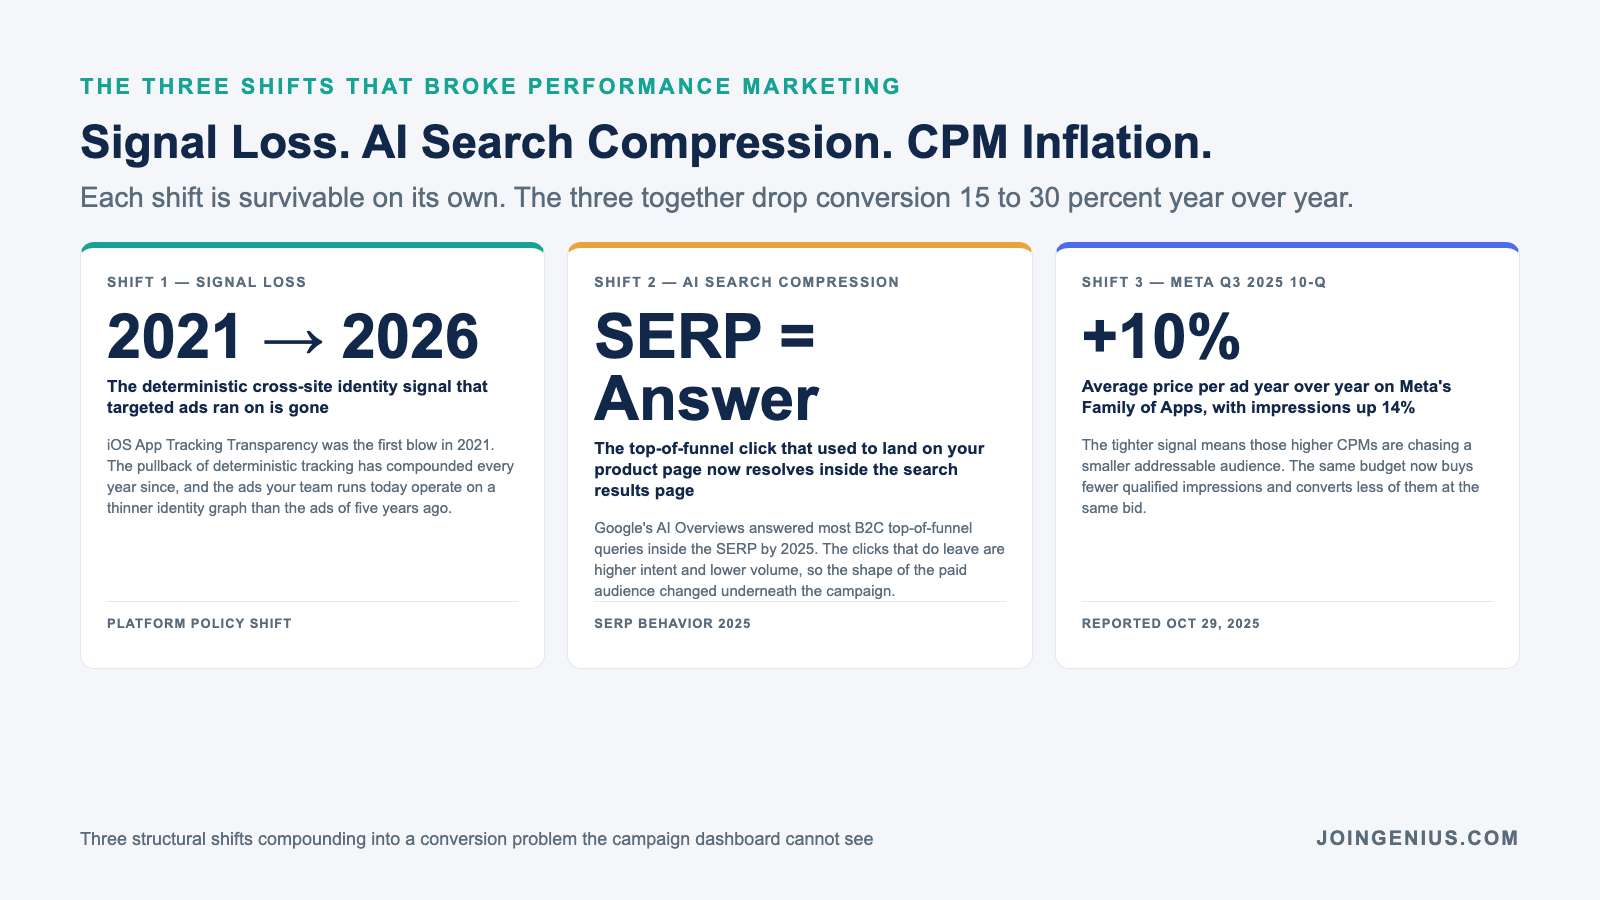
Shift one is signal loss. iOS App Tracking Transparency was the first blow in 2021, and the pullback of deterministic cross-site tracking that followed it has compounded every year since. The targeted ads your team ran five years ago had access to high quality identity signal. The ads they run today do not.
Shift two is AI search compression. Google’s AI Overviews answered the top-of-funnel query inside the search results page for most B2C intents by 2025. The click that used to land on your product page now resolves inside the SERP, and the only clicks that survive are higher intent and lower volume.
Shift three is comp inflation on the paid channel. CPMs on Meta and Google both climbed through 2025. Meta’s own Q3 2025 SEC filing reports that average price per ad rose 10 percent year over year, with ad impressions up 14 percent across the Family of Apps.
The tighter signal means those higher CPMs are chasing a smaller addressable audience. The same budget now buys fewer qualified impressions and converts less of them.
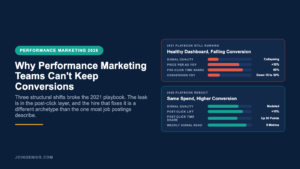
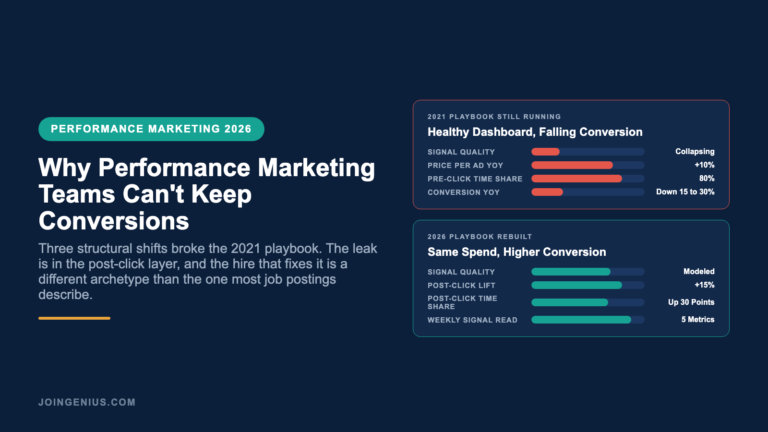
Each shift is survivable on its own. The three together compound into a conversion rate that falls 15 to 30 percent year over year even when every surface metric on the campaign side still looks healthy.
Why The Funnel Looks Fine But Conversion Keeps Falling
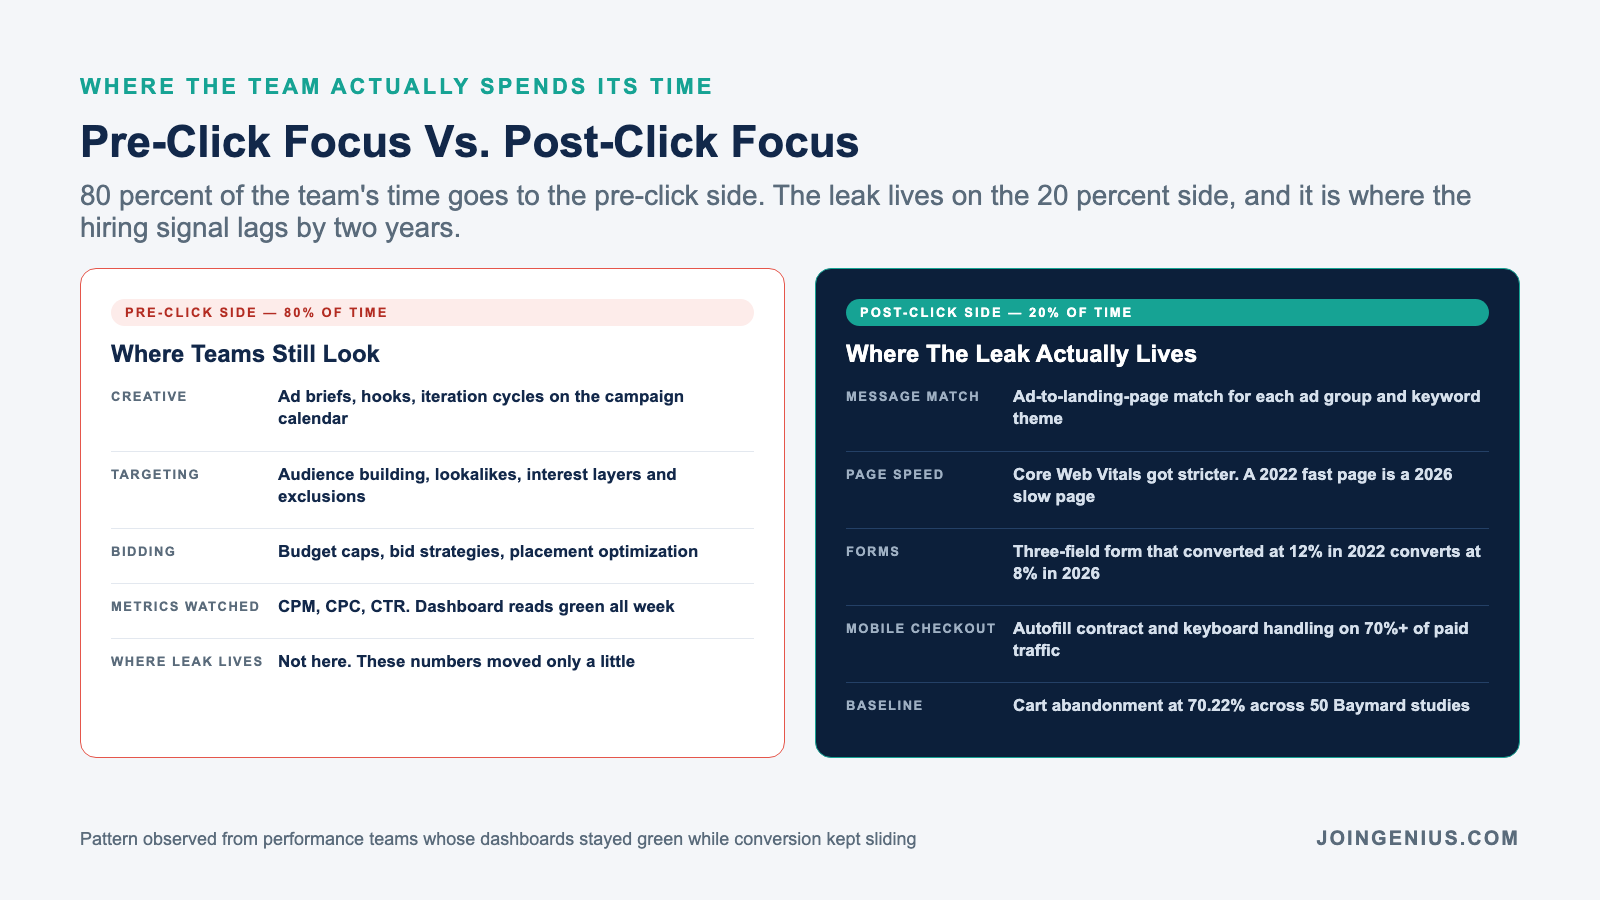
The reason this looks like a mystery to most CFOs is that the funnel dashboard still reads green. CPM is up a little and CPC is up a little. CTR is roughly flat. The drop is in the last mile of the funnel, which is where most performance teams stopped looking two hires ago.
Four leak points matter in 2026. Leak one is attribution lag. Multi-touch attribution models trained on 2022 deterministic data over-credit the last paid click and under-credit the organic or dark-social touch that actually drove intent. The result is a misallocated budget that chases low-intent clicks.
Leak two is landing page speed. Core Web Vitals got stricter through 2024 and 2025, and a page that loaded in 2.2 seconds in 2022 is now a slow page by Google’s own standard. A 1 second slowdown compounds against an already smaller addressable audience.
Leak three is form field decay. The three field form that converted at 12 percent in 2022 converts at 8 percent in 2026, because the audience has been trained by every other site to expect one field or a social login. Every extra field is now a measurable loss.
Leak four is the post-click experience on mobile. Over 70 percent of paid traffic is now mobile for most consumer verticals, and the checkout experience designed in 2021 for desktop still ships to a phone with poor keyboard handling and a missing autofill contract.
The Post-Click Layer Where Conversion Actually Breaks
This is the quiet place where most of the loss lives. Performance marketing teams spend 80 percent of their time on the pre-click side of creative and targeting. The remaining 20 percent goes to the post-click side of landing pages and checkout. The leak is now on the 20 percent side, and the hiring signal lags by two years.
Baymard Institute’s 2025 aggregate of 50 cart abandonment studies reports an average documented rate of 70.22 percent. That number has barely moved in a decade. Seven of every ten carts the paid traffic lands on never convert, and every percent of that gap recovered is paid traffic the business already bought.
The ad-to-landing-page match is the first place to look. Teams using a post-click platform like Flint that spins up campaign-matched landing pages for each ad group, and recommends ad account changes against them, close the message-match gap that otherwise shows up as a low post-click conversion rate even when the ad itself performs.
Fixing the post-click layer is the single highest return move a performance team can make in 2026. It does not require a new agency or another creative shop. It requires one engineer or product manager who treats the first 10 seconds after the click as a conversion optimization problem, not an IT one.
The ROI math on this is straightforward. A 15 percent lift on post-click conversion against a $400,000 monthly paid budget is $60,000 of recovered revenue per month at the same ad spend. That number pays for the hire in week one.
What To Hire For When CAC Won’t Stop Rising
The 2026 performance marketing hire looks different from the 2022 version. The old archetype was a campaign operator strong on bidding and creative briefs. The new archetype is a funnel engineer strong on behavioral data and landing page testing. The mechanics of what happens after the click are the center of the job.
Four screens matter. Screen one is funnel math literacy. The candidate should be able to walk you through the sensitivity of blended CAC to a 10 percent lift on post-click conversion without opening a spreadsheet.
Screen two is tool fluency on the post-click side. Ask them how they would test a change to the first above-the-fold section on a product page. A strong answer names a specific experimentation tool and a sample size calculation, not “we would run an A/B test.”
Screen three is behavioral analytics depth. Give them a session replay of a user who abandoned at the shipping step and ask them to identify the three friction points in order. The candidate who finds the autofill failure before the price shock is the one you want. Build this into your interview rubric.
Screen four is channel economics. A strong hire knows the current CAC payback period on the business and designs tests that protect it. A candidate who cannot tell you the difference between contribution margin and gross margin will optimize the wrong lever for the first two quarters.
A Weekly Dashboard That Separates Signal From Panic
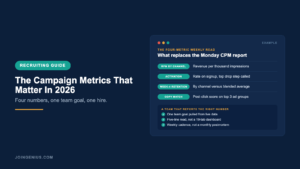
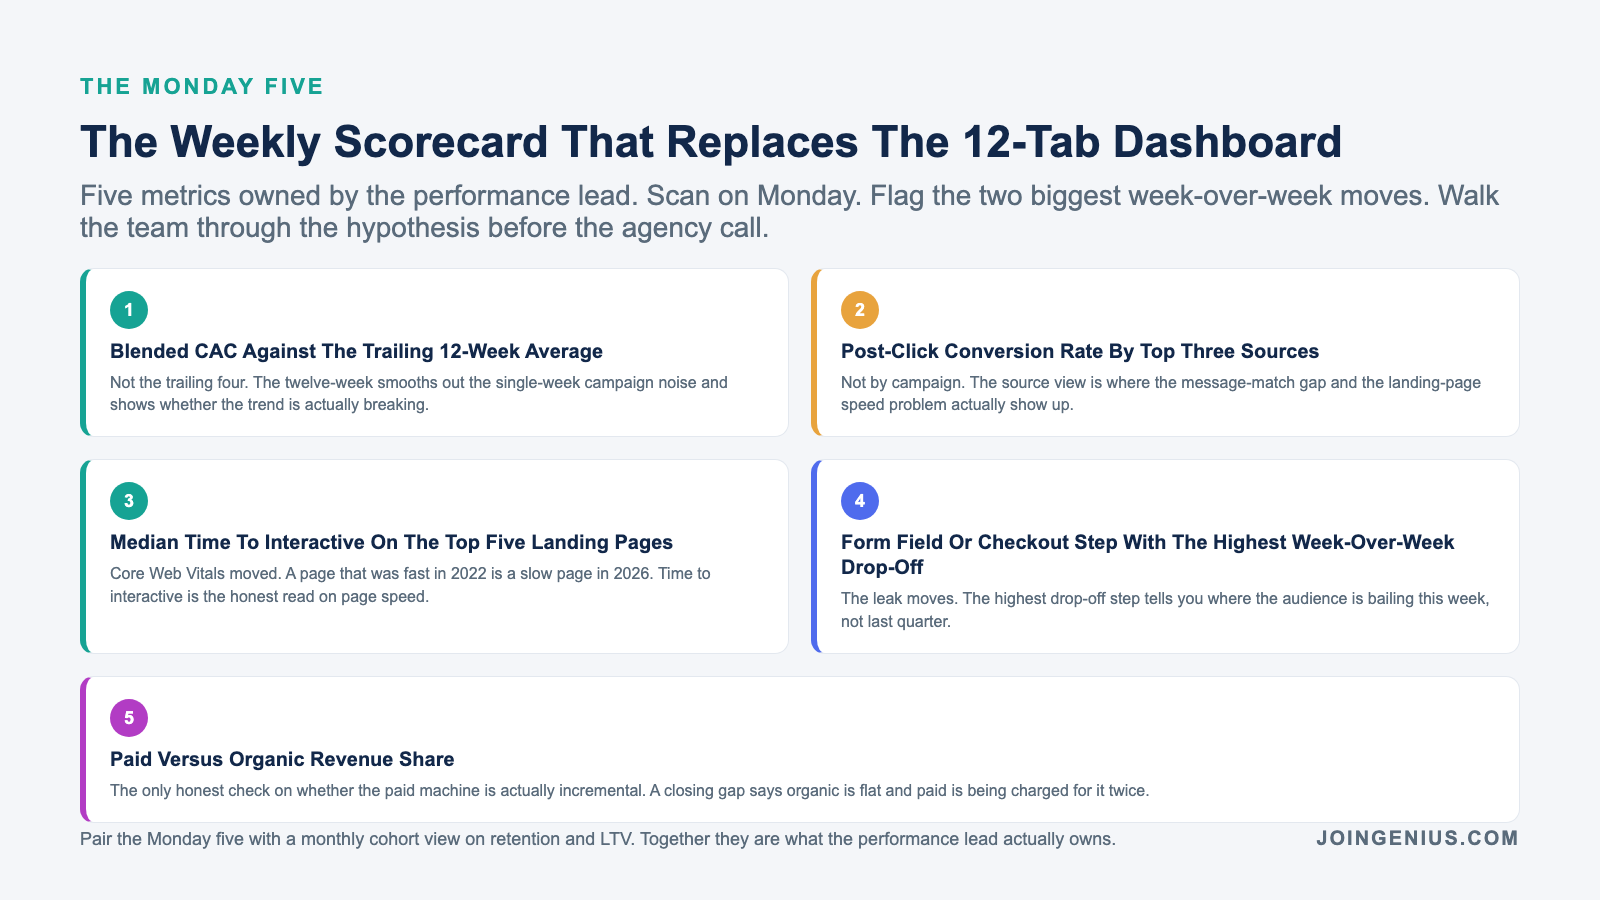
The replacement for the twelve tab Looker Studio dashboard most teams run is a weekly five metric read owned by the performance lead. The point is to make the real signal visible without a data team in the loop.
Metric one is blended CAC against the trailing 12 week average, not the trailing 4. Metric two is post-click conversion rate by top three sources, not by campaign. Metric three is median time to interactive on the top five landing pages.
Metric four is the form field or checkout step with the highest week over week drop-off. Metric five is paid versus organic revenue share, which is the only honest check on whether the paid machine is actually incremental.
Scan these five every Monday, flag the two biggest week over week moves, and walk the team through the hypothesis before the agency call. The conversation changes from “what are we spending on” to “where is the funnel breaking this week,” which is the only conversation that moves conversion.
Pair the weekly five with a monthly cohort view on retention and LTV. Performance marketing that only optimizes to the first purchase is the performance marketing that cannot keep customers long enough to earn the CAC back. The weekly and monthly reads together are what the performance lead actually owns.
Hire Performance Marketers Who Can Fix The Whole Funnel
The teams that keep conversion in 2026 are the ones who stopped hiring campaign operators and started hiring funnel engineers. They are the ones who moved 30 percent of the budget off the channel and onto the post-click surface, and they are the ones who have one person whose job is to own the first 10 seconds after the click.
The hiring window is tight. The US Bureau of Labor Statistics counts 421,600 marketing manager jobs in 2025 under its advertising and promotions category, with a 7 percent growth projection through 2035 and a median wage of $166,790. That is a seller’s market for the funnel engineer archetype you need to hire against.
Genius hires top one percent performance marketing and growth engineering talent from the Philippines and LATAM at roughly 80 percent less than local comp. There are no monthly fees and the placement comes with a six month replacement guarantee.
We screen on the four funnel engineer tests described on this page before any candidate reaches a hiring manager, so your sourcing funnel brings you people who will fix the post-click leak on day one, not people who will present another media plan on day thirty.