A support manager opens her weekly report and finds a long list of metrics. In the weekly meeting, someone asks which of them has changed a decision this quarter, and nobody can name one. That is an illustration, not a case study, but it shows a common problem: a dashboard can hold plenty of numbers and still not tell a team what to do next.
This guide explains which customer support metrics are worth tracking and what to pair each one with. It covers what a metric is for, the customer-side and agent-side measures worth keeping, a four-step plan, and a table of warning signs.
We found no study that ranks the best set of support metrics, so the advice rests on research about related measures and on our reasoning, which we label as such. It builds on our guide to why support team metrics can mislead, which looks at what common scores miss. This one asks what to track instead, and how to check it.
No Study Ranks a Universal Set of Support Metrics
Teams often look for a standard list of metrics that every support team should track. We found no study that tests such a list across teams, and the right set probably depends on the product, the channels, and the customers. Research can offer evidence about individual measures, with limits that we note as we go. Any advice that is not tied to a source is our reasoning, not a finding.
A Metric Earns Its Place by Changing a Decision
A useful test for any metric is simple: what would we do differently if this number moved? If the answer is nothing, the metric is decoration. If the answer is something, write it down next to the metric. A rise in repeat contacts might trigger a review of the help center. A rise in absence might trigger a review of schedules. This is our suggestion, not a tested method.
It also helps to separate targets, which people are asked to move, from signals, which people are asked to watch. Our guide to OKRs versus KPIs explains the difference. Targets deserve a counter-metric, since a team tends to move whatever it is rewarded for.
Customer-Side Measures Worth Keeping
Customer-side measures describe what happened to the person who asked for help. Three are worth a place in most sets, and each needs a check.
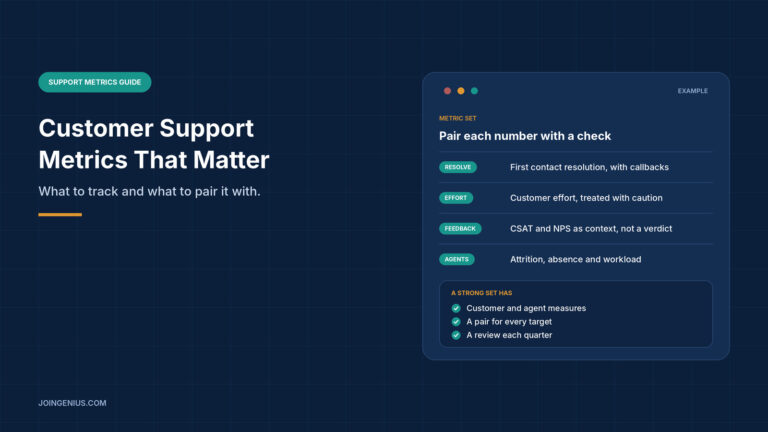
Resolution. First contact resolution shows how often one contact is enough. On its own, it can miss customers who gave up, so pair it with repeat contacts or callbacks.
Effort. A 2010 Harvard Business Review article by Matthew Dixon, Karen Freeman, and Nicholas Toman reports research from the Corporate Executive Board covering more than 75,000 people. According to the publisher’s summary, it found that customer effort score is a better predictor of loyalty than satisfaction measures or Net Promoter Score. We read only that summary and could not see the methods, and the research comes from an advisory firm, so treat it as a reason to test an effort question, not as settled.
Satisfaction and recommendation. Customer satisfaction, or CSAT, and Net Promoter Score, or NPS, work well as context. Timothy Keiningham, Bruce Cooil, Tor Wallin Andreassen, and Lerzan Aksoy tested the claim that Net Promoter beats other measures at predicting growth.
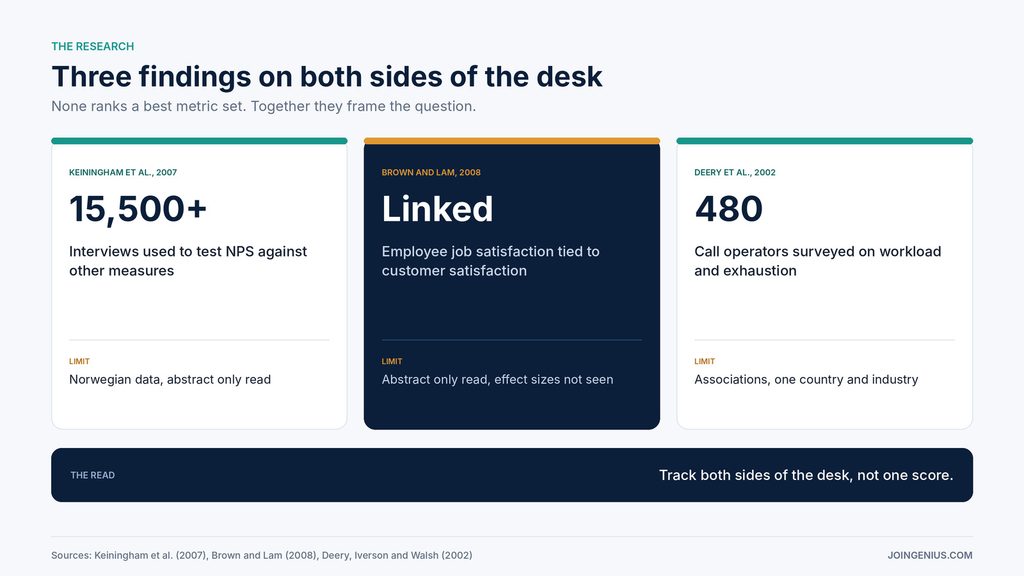
Their 2007 Journal of Marketing paper used longitudinal data from 21 firms and more than 15,500 interviews from the Norwegian Customer Satisfaction Barometer. The abstract says the study did not replicate the claim of the metric’s clear superiority. We read the abstract only, and the data come from Norway. The takeaway is modest: one popular score was not shown to be better than the alternatives, so it should not be the only number a team watches.
Agent-Side Measures Worth Adding
Customer-side measures show the result. Agent-side measures show the conditions behind it, and most dashboards carry few of them.
Michael Brown and Son Lam published a meta-analysis in the Journal of Retailing in 2008. The abstract reports that employee job satisfaction is positively related to customer satisfaction and to perceived service quality. We read the abstract only, so we did not see the effect sizes, and we have not confirmed that it covers contact centers. A relationship is also not proof that improving one raises the other.
Stephen Deery, Roderick Iverson and Janet Walsh add detail from the call center. Their 2002 paper in the Journal of Management Studies surveyed 480 telephone service operators across five Australian call centres. The abstract links workload, hostility and little task variety to emotional exhaustion, and exhaustion to absence. These are associations from one country and one industry, and we read the abstract only.
From that, three agent-side measures look worth tracking. They are our reasoning, not findings.
- Attrition. How many people leave, and how soon after joining.
- Absence. A rise can signal strain, and Deery and colleagues connect exhaustion to absence.
- Workload. Contacts per agent, scheduled hours, and the gap between planned and actual handle time. A schedule built on the wrong assumption can make a team look slow when it is simply overbooked.
Pair each with a customer-side measure. If attrition rises and satisfaction holds, the effect on customers may not have shown up yet. If both move the wrong way, the case for acting is stronger.
Add Agent Experience Measures to the Customer Ones
Trade sources can supply questions to put to your own data. One contributed article on CRMXchange makes the case for investing in agent experience by simplifying desktops, setting realistic workloads, and treating quality assurance as coaching. It cites no data, so we treat it as a source of questions to test, not proof. The page is undated and carries a promotional link, another reason for caution.
Several of its suggestions translate into measures. It proposes setting schedules and workloads from realistic handle-time data, which suggests tracking the gap between planned and actual handle time. It proposes structured onboarding, which suggests tracking satisfaction and resolution during the ramp-up period.
It suggests correlating attrition with CSAT or first-call resolution, and treating handle time as a diagnostic signal and not a score. It also says a slightly longer call that fully resolves an issue is usually better than a fast call that causes a callback, which is the pairing described above. We have not tested any of these, and each is a hypothesis to check against your own data.
A practical start is one chart that puts attrition beside repeat contacts over the same months. If the lines move together, you have a question worth investigating. Our guides on digital employee experience and workforce optimization go further on the people side.
A Four-Step Plan to Build Your Metric Set
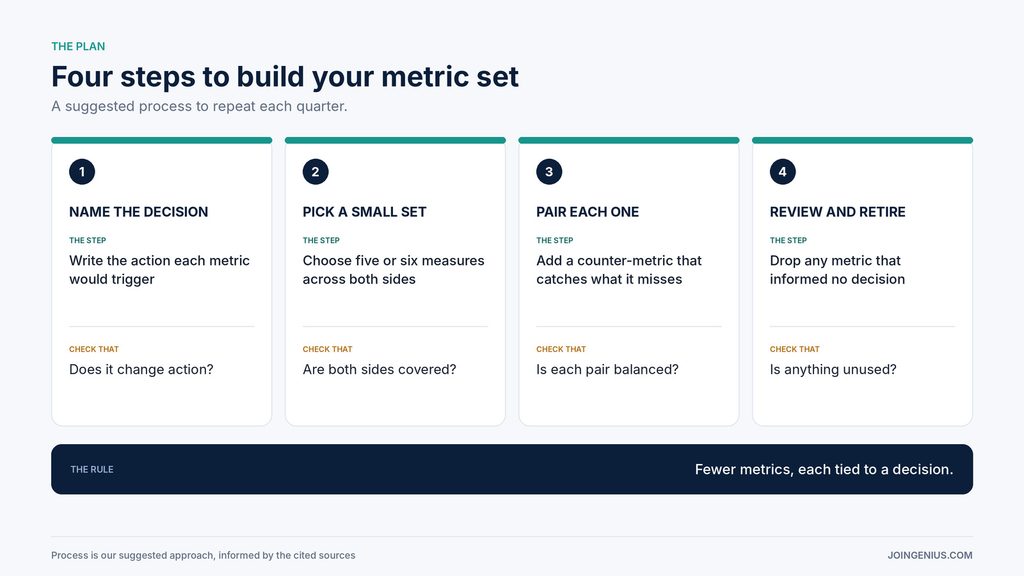
Use this four-step plan to build or rebuild your set. It is our suggested process, informed by the sources above.
- Name the decision. Write next to each candidate metric the action it would trigger. Drop any that trigger none.
- Pick a small set. Choose five or six measures that cover both sides, with at least one on resolution, one on effort or satisfaction, and one on agents. The number is our suggestion, not a finding. The point is that a team can actually discuss each measure.
- Pair each one. Give every target a counter-metric that catches what it misses, such as repeat contacts beside handle time, or attrition beside contacts per agent.
- Review and retire. Look at the set each quarter. Keep a metric only if it informs a decision, and replace it if not.
The last step matters most over time, because dashboards grow by addition and rarely shrink unless someone is assigned to cut. If an outside provider handles part of your support, the same discipline applies, and our guide to nearshore outsourcing KPIs covers measures for that setting.
Measure Whether the Set Works
Judge the set by what it changes, not by how it looks. Track how many metrics informed a decision this quarter and whether paired metrics ever disagreed. Ask agents whether the numbers describe their work, and read a small sample of real contacts to compare with the scores.
Name one person to own the review, and judge over several months, since one quarter can swing for reasons such as a product release. These measures are our suggestions, not findings. Our guide to employee engagement examples is a place to start for involving the team in that review.
Warning Signs Your Metric Set Is Not Working, and What to Do About Each
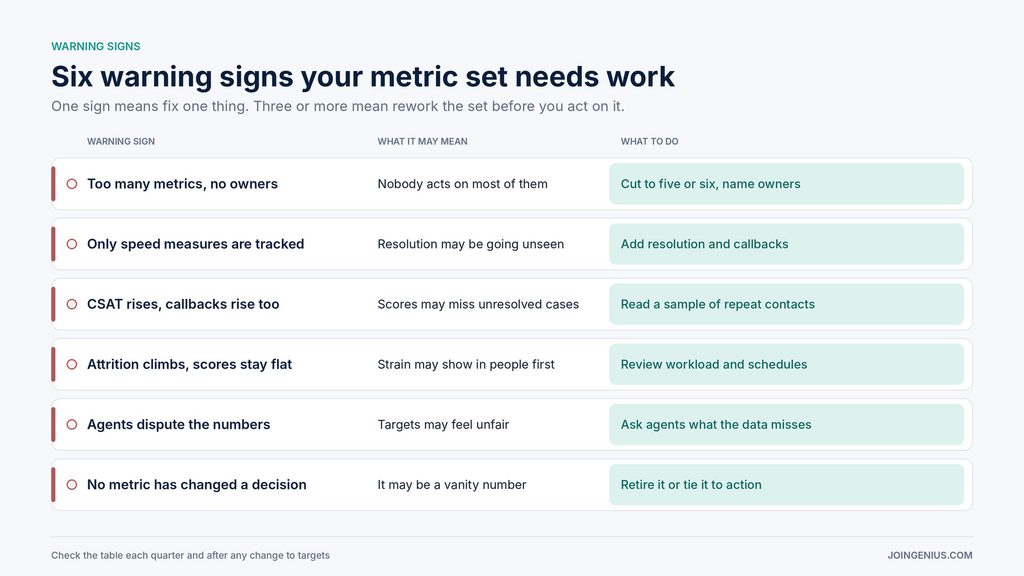
Check this table each quarter. One sign means fix one thing. Three or more mean rework the set before you act on it.
| Warning sign | What it may mean | What to do |
|---|---|---|
| Too many metrics, no owners | Nobody acts on most of them | Cut to five or six, name owners |
| Only speed measures are tracked | Resolution may be going unseen | Add resolution and callbacks |
| CSAT rises, callbacks rise too | Scores may miss unresolved cases | Read a sample of repeat contacts |
| Attrition climbs, scores stay flat | Strain may show in people first | Review workload and schedules |
| Agents dispute the numbers | Targets may feel unfair | Ask agents what the data misses |
| No metric has changed a decision | It may be a vanity number | Retire it or tie it to action |
Track for Decisions, Then Test the Set
A good set of customer support metrics is small, covers both customers and agents, and pairs every target with a check. Start by asking what each number would change, add the agent-side measures most dashboards leave out, and drop whatever has informed no decision. We found no study proving that this approach improves results, and the sources behind it have limits. But each step replaces a guess with something you can check.