
Weeks have passed since your nearshore outsourcing partnership kicked off, and you are still left wondering: Are they actually delivering? It is time to stop relying on vague metrics and gut instinct—and start tracking nearshore outsourcing KPIs that show real business impact, not just task completion.
No fluff. No reporting fatigue. Just 24 nearshore outsourcing KPIs that cut straight to performance—across speed, quality, cost, alignment, and customer experience. We will give you the blueprint to measure what matters, course-correct quickly, and build a relationship with the nearshore vendor that actually works.
24 Nearshore Outsourcing KPIs At A Glance

| Who Measures It | Ideal Range | |
| Time Zone Alignment Efficiency | Operations Manager / Delivery Lead | 60%–85% overlap |
| Response Time Performance | Support Manager / Team Lead / PM | <1 hr (support), <4 hrs (internal ops) |
| Average Resolution Time | Ops Lead / QA Manager / IT Service Manager | 2–4 hrs (support), 1–3 days (tech) |
| Sprint Velocity | Scrum Master / Engineering Manager | 20–40 pts/sprint |
| Cost Savings Percentage | Finance Director / COO | 40%–70% |
| Invoice Processing Cost | AP Manager / Finance Controller | $2.50–$5.00 (automated), $7.00–$12.00 (manual) |
| SLA Adherence Rate | Ops Lead / Vendor Manager / Function Head | 95%+ |
| Error Rate by Function | QA Manager / Finance Lead / CX Ops Lead | <2% (QA/dev), <1% (finance/CX) |
| Quality Score Assessment | QA Analyst / Audit Lead / CX Manager | 90%+ |
| Rework Percentage | Ops Manager / QA Lead / PMO | <5% |
| Bug Frequency / Defect Density | Engineering Manager / QA Analyst | <15 bugs per 1,000 LOC |
| Compliance Adherence Rate | Compliance Officer / Audit Lead / Legal | 98%+ |
| Communication Frequency Index | PM / Delivery Lead / Ops Manager | 5–10 touchpoints per sprint |
| Cultural Compatibility Score | HRBP / Delivery Lead / CSM | 7.5+ (out of 10) |
| Language Proficiency Metrics | HR / Vendor Manager / Functional Leads | B2+ (CX), C1+ (strategic roles) |
| Knowledge Transfer Effectiveness | Functional Lead / Onboarding Mgr / Project Owner | <15 days or <3 sprints |
| Customer Satisfaction Score (CSAT) | CX Lead / Support Manager / QA Analyst | 85%–95% |
| Net Promoter Score (NPS) | CX Director / Product Manager / Marketing Analyst | +30 to +50 |
| First Contact Resolution Rate (FCR) | Support Ops Lead / CX Analyst / QA Manager | 70%–90% |
| Customer Effort Score (CES) | CX Research Lead / Support Manager | 5.0–6.5 |
| Average Handle Time (AHT) | Contact Center Manager / Workforce Analyst | 6–8 mins |
| Business Value Added | Finance Director / Dept Heads / Vendor Mgr | 100%+ ROI in 6–12 months |
| Innovation Contribution Index | Functional Lead / PM / CIO | 10%–20% |
| Return On Investment (ROI) | Finance Head / CFO / CEO | 100%–200% annual ROI |
Check Out These Related Reads
🔥 Offshoring Solutions: 7 Models Explained With Examples
📣 Offshoring vs Nearshoring: 7 Core Differences Explained
🏅 17 Top-Rated Offshoring Companies For Fast-Growing Startups
What Are Nearshore Outsourcing KPIs & Why Do They Matter?

Nearshore outsourcing KPIs are specific, measurable indicators that help you track whether your external teams deliver real value. They go beyond output volume to show how well vendors perform across speed, quality, cost, communication, and customer impact.
Why Nearshore Outsourcing KPIs Matter
Review these 5 reasons why nearshore outsourcing KPIs matter and implement strategies to maximize their benefits.
- They help you spot red flags before they escalate. Use live dashboards (e.g., Power BI, Tableau) to track cycle times and SLA breaches weekly. Set threshold alerts so your team doesn’t miss slowdowns that cost you momentum.
- They reveal if you’re paying for output or outcomes. Compare cost-per-task with defect rates using tracked metrics like rework percentage or bug frequency. A low cost means nothing if the quality doubles your internal workload.
- They show you where to scale and where to pause. Sprint velocity and issue resolution times help you decide whether to ramp up the nearshore development team or rethink the scope. Use this data to adjust resourcing without guesswork.
- They give you negotiation power with vendors. Regularly report KPIs back to your partner using visual scorecards. Instead of vague feedback, let the data drive the next pricing discussion or contract renewal.
- They protect your brand across borders. Monitor CSAT, FCR, and compliance adherence closely. These metrics tell you how nearshore teams handle customer touchpoints and sensitive data. These are the 2 things that directly affect your reputation.
24 Must-Track Nearshore Outsourcing KPIs To Measure Success
Here are 24 nearshore outsourcing KPIs you must track to measure the success of your partnership.
Core Nearshore Outsourcing KPIs For Operational Efficiency

These KPIs track output, time efficiency, and cost control across functions like IT, support, and finance.
1. Time Zone Alignment Efficiency
What It Measures: How much of your nearshore team’s workday overlaps with your core team’s hours.
Who Measures It: Operations Manager or Delivery Lead
Formula: (Hours of overlap ÷ Total working hours) × 100
Ideal Range: 60%–85% overlap
What To Do:
- If Low (Below 60%): Set shared working hours and co-located sprint ceremonies using time zone planning tools like World Time Buddy.
- If High (Above 85%): Reduce forced overlap to avoid burnout. Consider rotating sync windows or async updates using Loom.
2. Response Time Performance (Average First Response SLA)
What It Measures: Average time it takes your nearshore team to respond to a task, ticket, or customer request.
Who Measures It: Support Manager, Team Lead, or Project Manager
Formula: Total time to first response ÷ Number of responses
Ideal Range: <1 hour for support, <4 hours for internal operations tasks
What To Do:
- If Low (Above 4 hrs): Use auto-triage tools like Zendesk triggers or Jira automations to flag unassigned items.
- If High (Below 10 mins): Review if too many people are working the same queue. This could inflate your staffing costs unnecessarily.
3. Average Resolution Time (TTR)
What It Measures: How long it takes to fully resolve a ticket, bug, or request after it’s received.
Who Measures It: Operations Lead, QA Manager, or IT Service Manager
Formula: Total resolution time ÷ Number of resolved items
Ideal Range: 2–4 hrs for support, 1–3 days for tech teams
What To Do:
- If Low (Above target): Break large issues into subtasks and add SLA-based escalation paths in your ticketing system.
- If High (Below target): Check if your team is resolving only “easy” tickets. Rebalance queue difficulty to reflect real workload.
4. Sprint Velocity (For Nearshore Development Teams)
What It Measures: The amount of work your development team completes per sprint.
Who Measures It: Scrum Master or Engineering Manager
Formula: Total story points completed ÷ Sprint
Ideal Range: 20–40 points/sprint for a 5–7 person team
What To Do:
- If Low (Below 20): Run a retrospective to pinpoint blockers. Use sprint planning tools like Jira Advanced Roadmaps to rebalance workload.
- If High (Above 40): Audit story point accuracy. Teams may be inflating estimates or under-testing outputs.
5. Cost Savings Percentage (Vs Onshore Or In-House)
What It Measures: How much you’re saving compared to hiring the same talent in-house or onshore.
Who Measures It: Finance Director or COO
Formula: ((Onshore cost – Nearshore cost) ÷ Onshore cost) × 100
Ideal Range: 40–70%
What To Do:
- If Low (Below 30%): Review blended rates and scope creep. Consider switching from full-time staff to staff augmentation or hybrid teams.
- If High (Above 70%): Make sure you’re not sacrificing quality. Cross-check with error rates and rework percentages.
6. Invoice Processing Cost (Compare Manual Vs Automated Ranges)
What It Measures: Total cost to process each invoice end-to-end.
Who Measures It: AP Manager or Finance Controller
Formula: (Total AP cost ÷ Number of invoices processed)
Ideal Range: $2.50–$5.00 per invoice (automated); $7.00–$12.00 per invoice (manual)
What To Do:
- If Low (Above $7): Introduce invoice automation tools like Tipalti or Yooz to cut manual processing time.
- If High (Below $2): Check if your current setup is skipping validation or fraud checks. Too cheap can be risky.
7. Service Level Agreement (SLA) Adherence Rate
What It Measures: Percentage of tasks, tickets, or deliverables completed within the agreed timeframe.
Who Measures It: Operations Lead, Vendor Manager, or Function Head
Formula: (Tasks completed on time ÷ Total tasks) × 100
Ideal Range: 95%+
What To Do:
- If Low (Below 90%): Set tiered SLA triggers and penalties in your contract. Push for root-cause analysis on missed timelines.
- If High (Above 99%): Your SLAs may be too lenient. Tighten the scope or reallocate the budget to higher-impact work.
Nearshore Outsourcing KPIs For Quality Assurance

These metrics track how well your nearshore teams deliver on output quality, accuracy, and compliance expectations.
8. Error Rate By Function (QA, Finance, CX, Development)
What It Measures: Frequency of errors by function type (e.g., code bugs, invoice mismatches, support mistakes).
Who Measures It: QA Manager, Finance Lead, CX Operations Lead
Formula: (Number of errors ÷ Total output volume) × 100
Ideal Range: Under 2% (QA/development), Under 1% (finance/CX)
What To Do:
- If Low (Above target): Review QA processes per function. Add peer reviews or automate double-checking in high-risk areas.
- If High (Below 0.5%): You may be over-testing. Reallocate QA hours to spot-checking or strategic automation.
9. Quality Score Assessment (Call Center, Audit, or Development QA Scores)
What It Measures: Overall quality rating for nearshore work, based on pre-defined scorecards.
Who Measures It: QA Analyst, Audit Lead, CX Manager
Formula: (Sum of quality scores ÷ Total assessments) × 100
Ideal Range: 90%+
What To Do:
- If Low (Below 85%): Rework your QA rubric. Focus on common failure themes like documentation gaps or tone issues.
- If High (Above 95%): Spot-check QA scoring consistency. You might be inflating scores or missing edge cases.
10. Rework Percentage
What It Measures: How much deliverable work is returned for revisions, fixes, or clarifications.
Who Measures It: Operations Manager, QA Lead, PMO
Formula: (Rework items ÷ Total submitted items) × 100
Ideal Range: Under 5%
What To Do:
- If Low (Above 8%): Add checklist-based reviews before final handoffs. For development teams, flag unclear acceptance criteria early.
- If High (Below 2%): You may be over-policing. Trust nearshore leads to self-correction and focuses QA on high-value outputs.
11. Bug Frequency / Defect Density (For Tech/Engineering)
What It Measures: How many bugs or defects show up per unit of software delivered.
Who Measures It: Engineering Manager, QA Analyst
Formula: (Number of bugs ÷ 1,000 lines of code or story points)
Ideal Range: Under 15 bugs per 1,000 LOC
What To Do:
- If Low (Above 20): Add pre-merge code reviews and static analysis tools like SonarQube.
- If High (Below 5): Audit bug classification. Your team may underreport or mislabel defects.
12. Compliance Adherence Rate (GDPR, SOX, USMCA, HIPAA, etc.)
What It Measures: How consistently your nearshore partner follows required legal and compliance standards.
Who Measures It: Compliance Officer, Audit Lead, Legal Counsel
Formula: (Number of compliant items ÷ Total audited items) × 100
Ideal Range: 98%+
What To Do:
- If Low (Below 95%): Provide refresher training on specific compliance gaps. Run quarterly audits using tools like Vanta or Drata.
- If High (100%): Review your audit scope. Include edge cases, new templates, or workflow deviations to strengthen risk coverage.
“If you can’t measure what matters, you’re not outsourcing—you’re just delegating and hoping for the best.”
—Burkhard Berger, Founder & CEO
Communication & Cultural Alignment KPIs
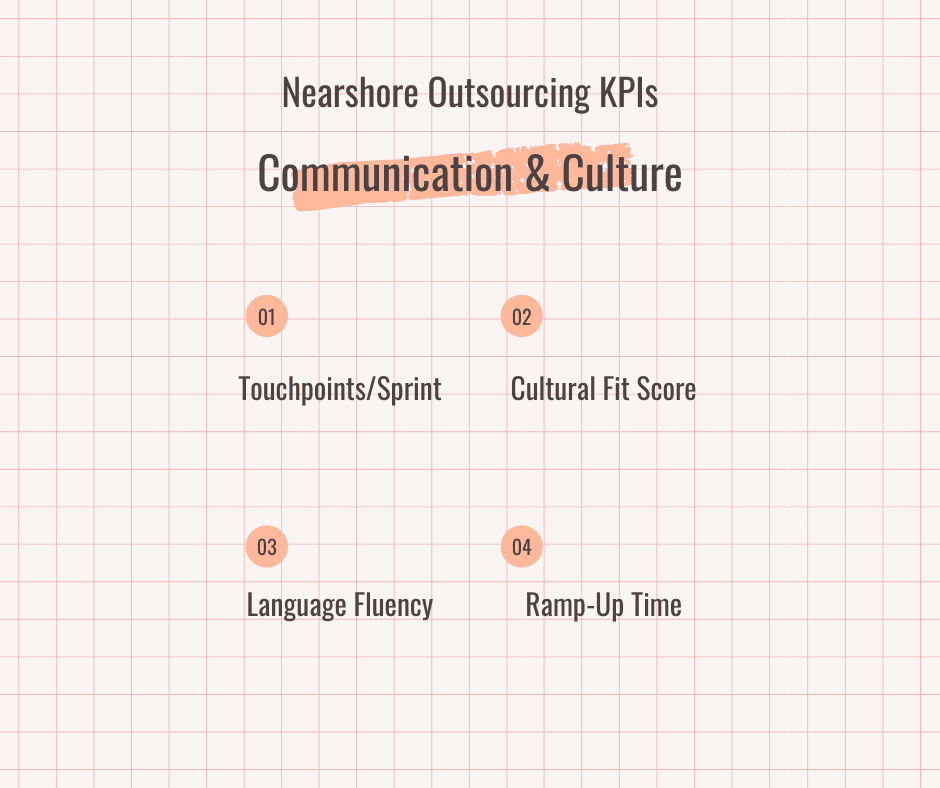
These KPIs help you catch misalignment before it starts eating into your delivery cycles or team trust.
13. Communication Frequency Index (Touchpoints Per Sprint/Project/Issue)
What It Measures: Tracks how often your teams connect on key issues, like project blockers, approvals, or status updates, within a set timeframe.
Who Measures It: Project Manager, Delivery Lead, or Operations Manager
Formula: Total meaningful touchpoints (calls, Slack threads, comments) ÷ Number of project weeks
Ideal Range: 5–10 structured touchpoints per sprint (varies by team type)
What To Do:
- If Low (Below 5): Set a fixed cadence for cross-team check-ins (e.g., 2x/week async update + 1 live sync). Use Loom or Slack threads to fill in timezone gaps.
- If High (Above 10): Too much back-and-forth may signal unclear ownership. Streamline escalation paths and use RACI (Responsible, Accountable, Consulted, and Informed) charts to reduce decision bottlenecks.
14. Cultural Compatibility Score (Survey-Based Or Manager-Assessed)
What It Measures: Assesses how well your nearshore team fits your company’s communication norms, working style, and feedback expectations.
Who Measures It: HR Business Partner, Delivery Lead, or Client Success Manager
Formula: Average score from manager or team survey on collaboration, responsiveness, and adaptability (1–10 scale)
Ideal Range: 7.5+ for high-functioning vendor relationships
What To Do:
- If Low (Below 7): Run a quick culture audit. Offer short video onboarding on your team’s norms. Assign a culture sponsor or buddy system for smoother day-to-day sync.
- If High (Above 9): You’ve likely got a keeper. Use this to build a longer-term vendor strategy or shift more strategic work their way.
15. Language Proficiency Metrics (English/Spanish/Portuguese Fluency Benchmarks)
What It Measures: Tracks fluency in key working languages (usually English, Spanish, or Portuguese) for both written and verbal communication.
Who Measures It: HR or Vendor Relationship Manager (with support from functional leads)
Formula: Fluency scores from internal assessments or third-party tools like Versant or Duolingo English Test
Ideal Range: CEFR Level B2+ (upper intermediate) for customer-facing; C1+ (advanced) for strategic roles
What To Do:
- If Low (Below B2): Offer access to online language coaching tools like Preply or Busuu. Focus on improving listening and writing first.
- If High (Above C1): Leverage this fluency for customer calls, stakeholder demos, or internal documentation projects.
16. Knowledge Transfer Effectiveness (Ramp-Up Time, Handoff Quality)
What It Measures: Evaluates how quickly and completely your nearshore team picks up critical workflows, tools, or context.
Who Measures It: Functional Lead, Onboarding Manager, or Project Owner
Formula: Ramp-up time (in days or sprints) + number of clarification loops during handoff
Ideal Range: <15 business days for support/admin roles; <3 sprints for engineering or analytics
What To Do:
- If Low (Ramp-up >15 days or too many rework cycles): Use 30/60/90-day onboarding plans and record walkthroughs for repeatable training.
- If High (Ramp-up <7 days with minimal follow-up): Assign this team to higher-value projects or cross-functional initiatives—they’re built for speed.
📢 Did You Know?
92% of US manufacturing executives have thought about nearshoring.
Customer Experience KPIs For Nearshore Teams

Track these regularly to protect your reputation and retention rates.
17. Customer Satisfaction Score (CSAT)
What It Measures: Shows how happy customers are with a recent interaction, usually after a support ticket or service call.
Who Measures It: CX Lead, Support Manager, or QA Analyst
Formula: (Total positive responses ÷ Total responses) × 100
Ideal Range: 85–95% for nearshore customer-facing teams
What To Do:
- If Low (Below 80%): Review support transcripts. Use QA scorecards to identify tone issues or missing resolutions. Roll out empathy + resolution training.
- If High (Above 95%): Your team’s setting a gold standard. Capture winning call snippets for training or vendor knowledge libraries.
18. Net Promoter Score (NPS) (Specific To Nearshore Channels)
What It Measures: Reflects long-term loyalty as it asks how likely a customer is to recommend your brand.
Who Measures It: CX Director, Product Manager, or Marketing Analyst
Formula: % Promoters (9–10) – % Detractors (0–6)
Ideal Range: +30 to +50 for nearshore teams supporting customer journeys
What To Do:
- If Low (Below +20): Run a win/loss analysis. Focus on root causes—delays, tone, escalation issues—and fix 1 at a time.
- If High (Above +50): You’re in the top tier. Use this score to make the case for expanding nearshore support coverage or tier-1 handoffs.
19. First Contact Resolution Rate (FCR)
What It Measures: Shows how many customer issues are fully resolved during the first interaction, without follow-ups.
Who Measures It: Support Operations Lead, CX Analyst, or QA Manager
Formula: (Total cases resolved on first touch ÷ Total cases) × 100
Ideal Range: 70–90%, depending on complexity
What To Do:
- If Low (Below 70%): Add pre-call workflows in your CRM. Flag repeat issues and build knowledge base content around them.
- If High (Above 90%): Use it to standardize escalation thresholds. Consider moving tier-2 issues to the nearshore team if they handle complex cases well.
20. Customer Effort Score (CES)
What It Measures: Captures how easy it is for a customer to get their issue resolved—less friction means more loyalty.
Who Measures It: CX Research Lead or Support Manager
Formula: Avg. score from customer survey question: “The company made it easy to resolve my issue.” (1 = Strongly disagree, 7 = Strongly agree)
Ideal Range: 5.0–6.5 for smooth service across channels
What To Do:
- If Low (Below 5): Map the support journey. Remove extra steps like re-authentication or long hold times. Introduce chat or callback options.
- If High (Above 6.5): Celebrate the team. Document low-effort practices and share them with other functions or markets.
21. Average Handle Time (AHT) (Support Centers)
What It Measures: Shows how long it takes an agent to resolve a customer query, including talk, hold, and wrap-up time.
Who Measures It: Contact Center Manager or Workforce Analyst
Formula: (Total talk + hold + after-call time) ÷ Total number of interactions
Ideal Range: 6–8 minutes for most support teams
What To Do:
- If Low (Below 5 Minutes): Speed isn’t always a win. Review whether reps rush through calls without full resolutions.
- If High (Above 9 Minutes): Break down the flow. Use call recordings to spot delays (e.g., slow systems, unclear steps) and fix them.
Strategic Value KPIs In Nearshore Outsourcing
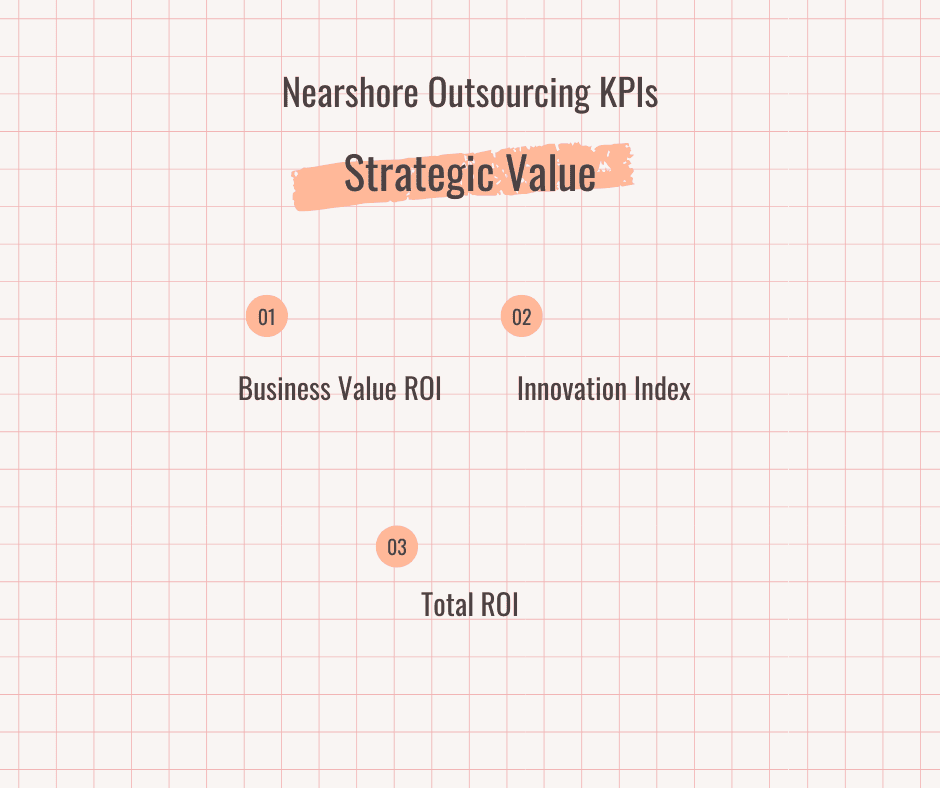
These nearshore outsourcing KPIs show whether your nearshore partner contributes to business growth, innovation, and smart resourcing.
22. Business Value Added (ROI Or Cost-To-Value Ratios Per Function)
What It Measures: Tracks how much value the nearshore partner delivers compared to what you spend, by function or department.
Who Measures It: Finance Director, Department Heads, or Vendor Relationship Manager
Formula: (Value Delivered – Cost Incurred) ÷ Cost Incurred × 100
Ideal Range: 100%+ ROI within 6–12 months for most functions
What To Do:
- If Low (Below 75%): Audit the deliverables and internal costs saved. Shift underperforming functions back in-house or re-scope the contract.
- If High (Above 150%): Document value cases and share them with leadership. Use this proof to secure the budget for other nearshore initiatives.
23. Innovation Contribution Index
What It Measures: Tracks how often your nearshore team proactively suggests smarter ways to work—new tools, process fixes, or tech upgrades.
Who Measures It: Functional Lead, Project Manager, or CIO
Formula: (# of valid ideas suggested by vendor ÷ Total ideas received by function) × 100
Ideal Range: 10–20% of all process or tech improvements in a quarter
What To Do:
- If Low (Below 5%): Include innovation KPIs in your quarterly review. Ask the vendor to assign a process improvement lead.
- If High (Above 25%): Set up a monthly innovation sync. Prioritize the top 3 suggestions and fast-track pilot tests internally.
24. Return On Investment (ROI)
What It Measures: Gives a high-level view of what you gained—financially or operationally—compared to what you spent on nearshore outsourcing.
Who Measures It: Finance Head, CFO, or CEO (for executive reporting)
Formula: (Net Profit or Gains from Nearshore Partnership ÷ Total Outsourcing Cost) × 100
Ideal Range: 100–200% annual ROI is considered strong
What To Do:
- If Low (Below 80%): Break ROI down by function. Shift resources away from low-impact areas or renegotiate terms with underperforming vendors.
- If High (Above 200%): Reinforce high-performing partnerships. Lock in multi-year terms or expansion with incentive-based pricing.
“Great teams understand what targets mean. That’s the difference between output and impact.”
—Christian Cabaluna, Senior Recruiter
Nearshore Outsourcing KPIs vs Offshore & Onshore Benchmarks: How Do They Stack Up?
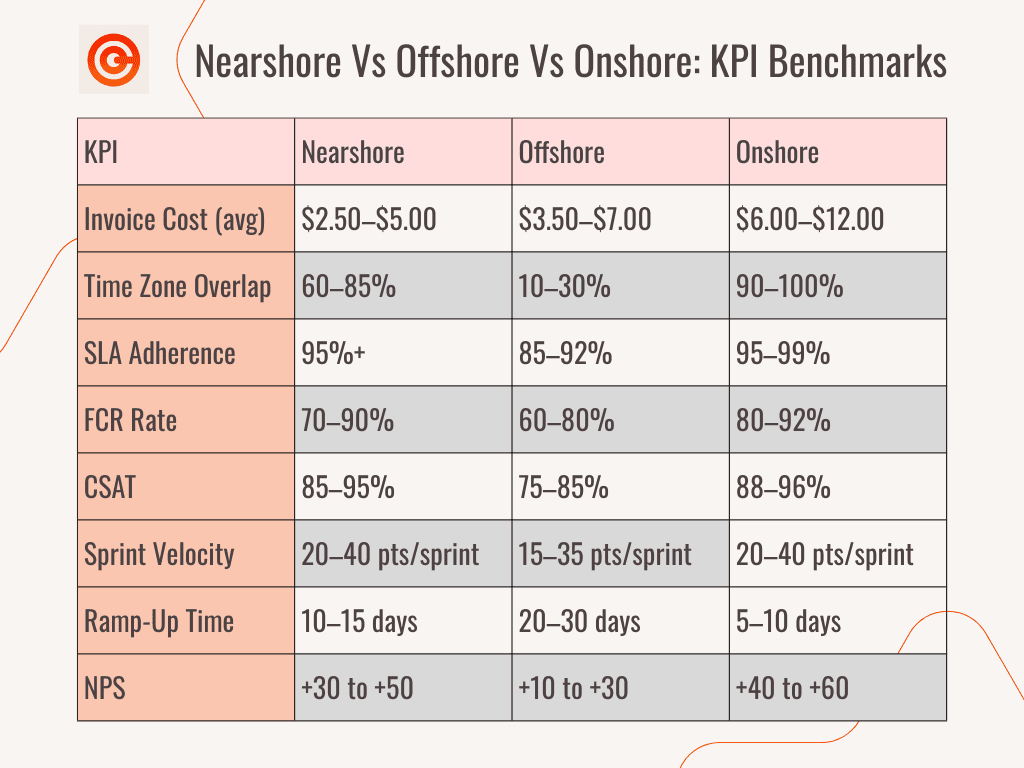
Use this table to see which model fits your goals: nearshore, offshore, or onshore.
| KPI Category | Nearshore | Offshore | Onshore |
| Average Invoice Processing Cost | $2.50–$5.00/invoice | $3.50–$7.00/invoice | $6.00–$12.00/invoice |
| Time Zone Overlap with US Teams | 60–85% | 10–30% | 90–100% |
| SLA Adherence Rate | 95%+ | 85–92% | 95–99% |
| First Contact Resolution Rate | 70–90% | 60–80% | 80–92% |
| CSAT (Customer Satisfaction Score) | 85–95% | 75–85% | 88–96% |
| Sprint Velocity (Dev Teams) | 20–40 pts/sprint | 15–35 pts/sprint | 20–40 pts/sprint |
| Knowledge Transfer Ramp-Up (Days) | 10–15 days | 20–30 days | 5–10 days |
| Net Promoter Score (NPS) | +30 to +50 | +10 to +30 | +40 to +60 |
5 Best Practices To Set Up & Monitor Nearshore Outsourcing KPIs
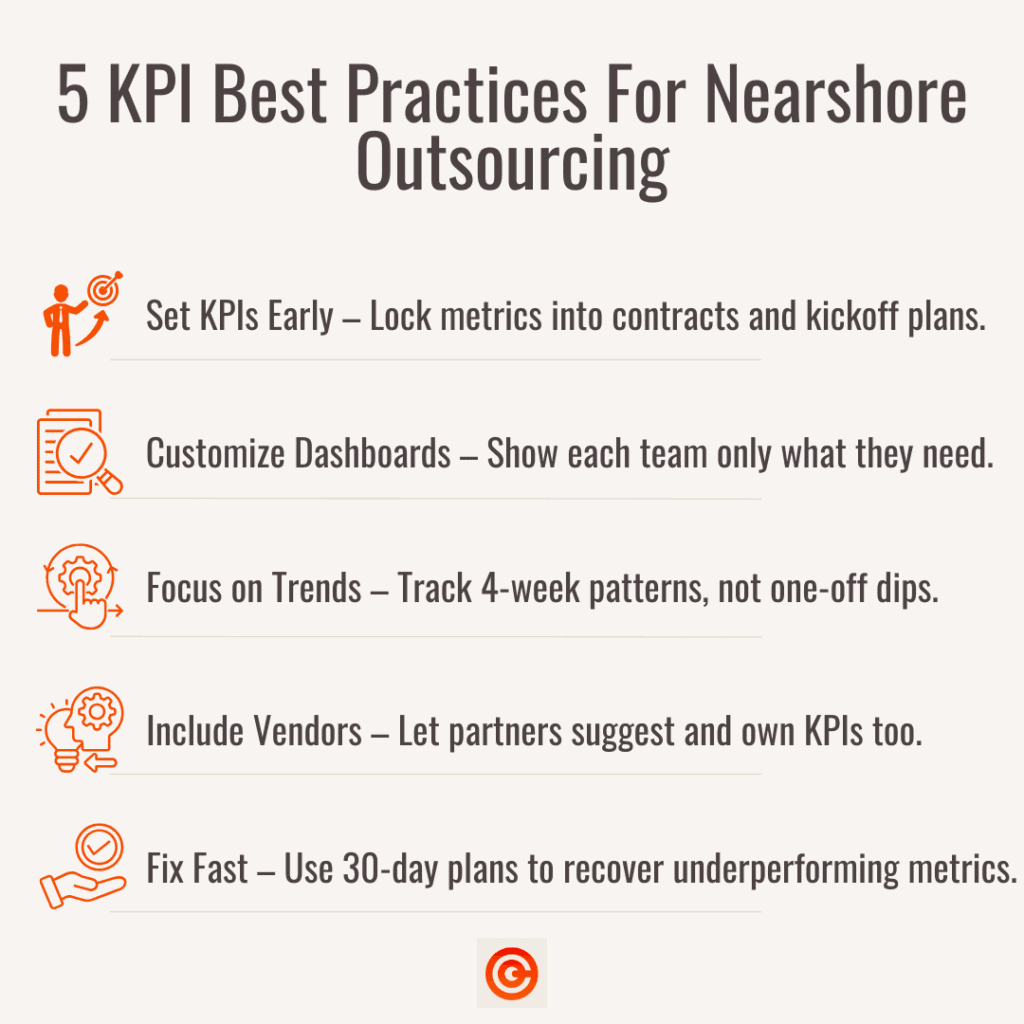
Implement these 5 best practices to save weeks of backtracking and missed red flags later on.
1. Make KPIs Part Of Your Kickoff, Not Your Cleanup
Waiting until post-launch to define KPIs usually means you’ll end up tracking the wrong things or missing early red flags. Bring KPIs into your vendor onboarding checklist from day 1 so both sides know exactly what success looks like.
- Add KPI expectations in your MSA (Master Services Agreement) and SOW (Statement of Work) before signing.
- Hold a joint goal-setting session during onboarding.
- Use real examples from past projects to define baseline benchmarks.
- Document KPI ownership by function, not just the vendor.
- Share weekly snapshots for the first 30 days to catch early patterns.
2. Keep Different Teams On Different Dashboards
Your CFO doesn’t need sprint velocity. Your product manager doesn’t care about invoice cycle time. Build custom dashboards by function so every stakeholder sees only what they need—nothing more, nothing less.
- Use Databox, ClickUp, or Power BI to segment views.
- Set field-level visibility rules for sensitive KPIs (e.g., compliance metrics).
- Sync dashboards with Slack or email for auto-distribution.
- Assign a dashboard owner per department to keep data clean.
- Refresh KPI views monthly to reflect shifting priorities.
3. Review Trends, Not Just Numbers
Don’t overreact to a single bad week. KPI tracking should highlight patterns, not punish one-off dips. Focus on what’s trending and course-correct with context.
- Group metrics into rolling 4-week averages.
- Add annotations to charts for anomalies (e.g., holiday backlog).
- Review variances during monthly vendor syncs.
- Ask: Is this KPI slipping gradually or spiking randomly?
- Use trendlines to set your next round of quarterly targets.
4. Let Your Vendors Flag What Matters Too
You hired your vendor for their expertise. So let them weigh in. Invite them to suggest new KPIs, flag blind spots, or push back on vanity metrics that waste time.
- Run quarterly reviews that include vendor-driven insights.
- Set up a shared KPI backlog board for new suggestions.
- Encourage nearshore leads to comment on dashboard trends.
- Score vendor involvement in innovation as a separate KPI.
- Reward transparency instead of just perfect numbers.
5. Put Underperforming KPIs On A 30-Day Fix Plan
If something’s broken, don’t let it drift. Flag KPIs that fall below target and commit to a short-cycle action plan—owned by 1 person, not a committee.
- Create a KPI “fix template” with root cause, owner, and next steps.
- Set a clear start and end date for remediation.
- Check progress weekly and log it in your dashboard.
- Escalate or revise the goal if there’s no improvement in 30 days.
- Track how many KPIs have active fix plans at any given time.
🔥 Interesting Fact
Over 800 companies use the Philippines for call center services.
KPI Reporting Templates You Can Send To Your Nearshore Vendors
Use a KPI template to track, review, and report KPIs with your nearshore vendors without the back-and-forth.
Download the Nearshore Outsourcing KPI Reporting Template Now
Recent Nearshore Outsourcing KPI Trends For Modern Partnerships
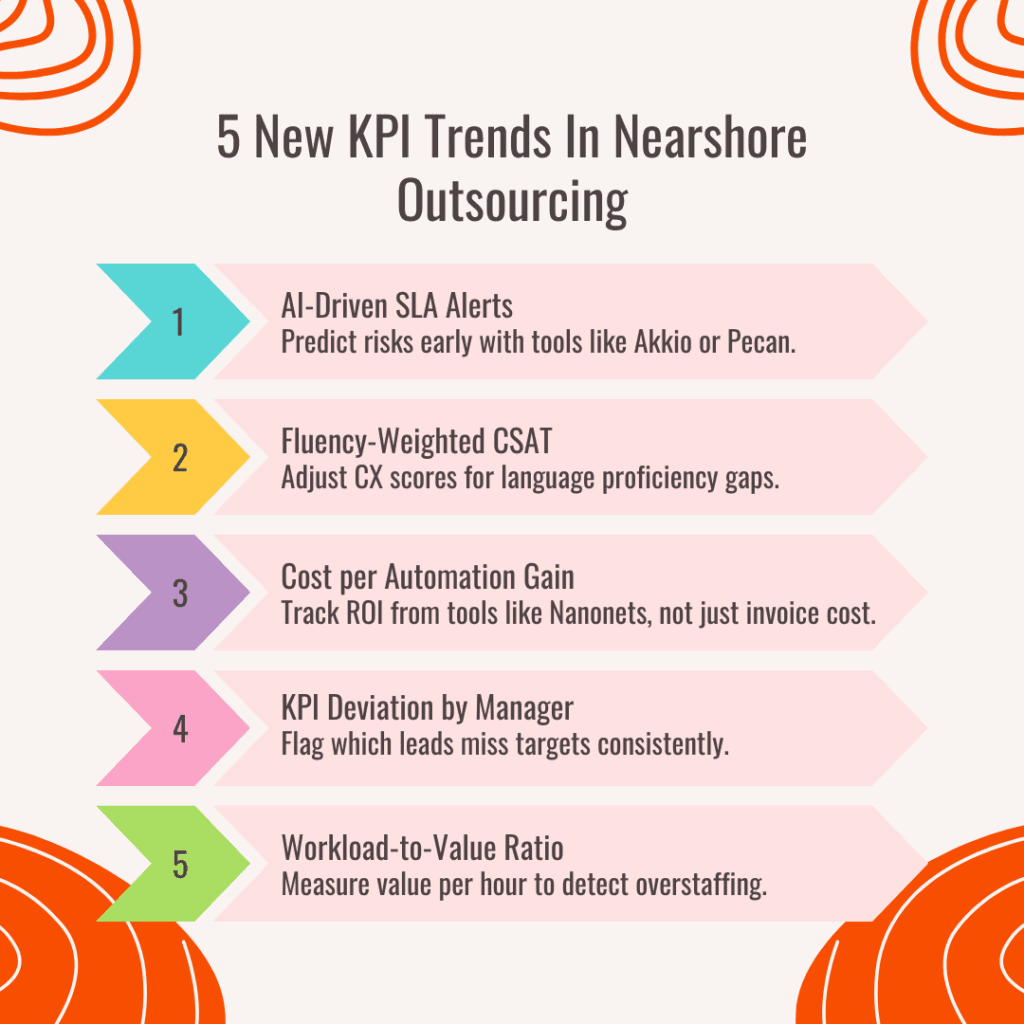
Make sure you follow these 5 most recent nearshore outsourcing KPI trends to stay ahead.
- AI-assisted forecasting for SLA risk: Teams now use AI models to flag likely SLA breaches before they happen. Feed your historical SLA data into platforms like Pecan or Akkio to generate proactive alerts.
- Fluency-weighted CX metrics: Nearshore CX teams in LATAM now face KPIs that weigh CSAT or FCR scores against language proficiency. Use weighted averages in dashboards to separate communication gaps from service quality issues.
- Cost-per-automation gain in back-office roles: Finance teams have started tracking “cost-per-automation gain” instead of just invoice cost. Pair automation tools like Nanonets with real-time processing benchmarks to surface this KPI.
- KPI deviation rate per manager: Instead of reporting KPIs in isolation, companies now track which team leads hit or miss benchmarks most consistently. Use variance tracking in ClickUp or Monday.com to flag patterns by supervisor.
- Workload-to-value ratio (WVR): Some vendors now measure “value created per workload hour” to surface hidden overstaffing. Use time-tracking integrations with Harvest or Hubstaff to benchmark output vs effort per task category.
💭 Food For Thought
More than 50% of companies outsource customer service to improve efficiency and cut costs.
5 Challenges In Measuring Nearshore Outsourcing KPIs (+ Solutions)
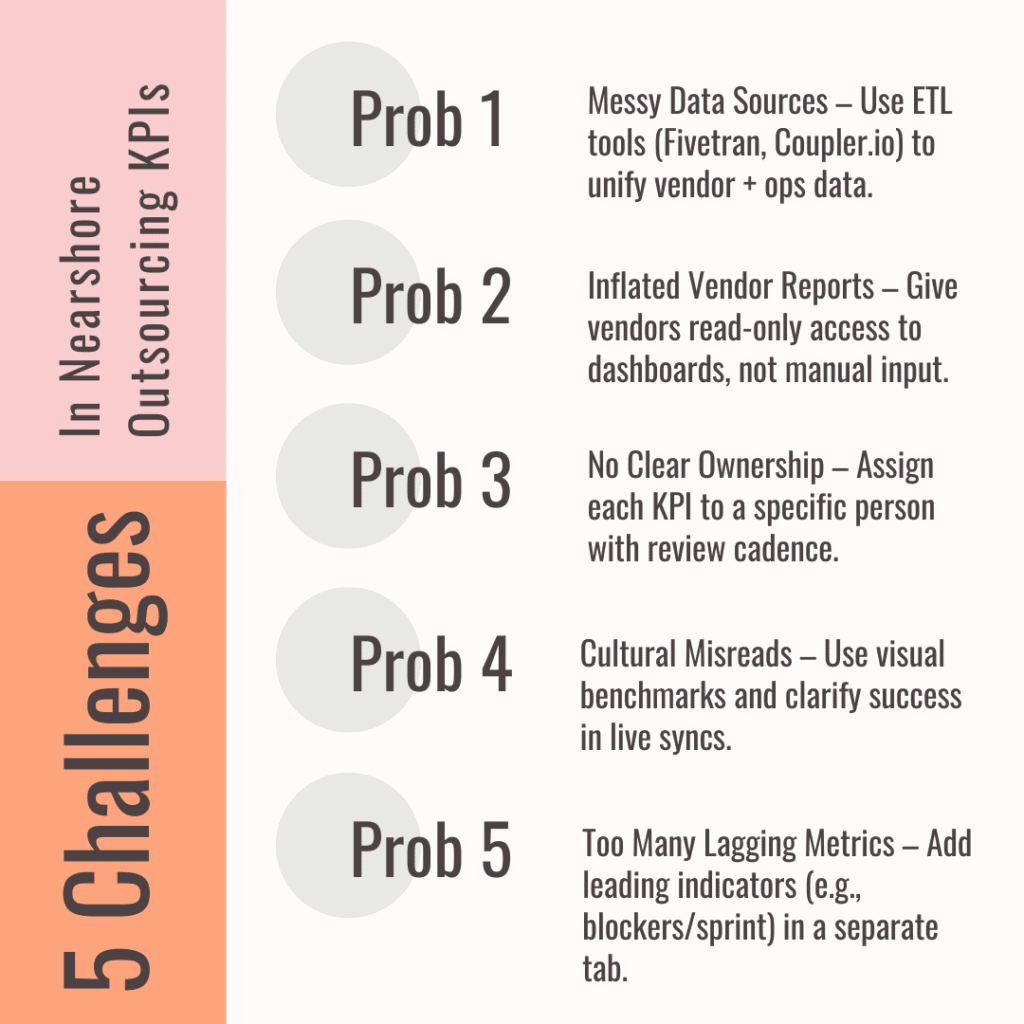
Solve these 5 challenges before they drag down your reporting process or distort what performance actually looks like.
- Inconsistent data formats across tools
- Solution: Use ETL platforms like Fivetran or Coupler.io to clean and unify vendor, project, and finance data into one source before pulling KPIs. Sync everything to a shared Google Sheet or dashboard to avoid manual wrangling.
- Solution: Use ETL platforms like Fivetran or Coupler.io to clean and unify vendor, project, and finance data into one source before pulling KPIs. Sync everything to a shared Google Sheet or dashboard to avoid manual wrangling.
- Vendors self-reporting inflated numbers
- Solution: Add read-only access to live dashboards for vendors instead of letting them submit KPI reports manually. Use automated audit logs (e.g., in Power BI or Tableau) to track when metrics change.
- Solution: Add read-only access to live dashboards for vendors instead of letting them submit KPI reports manually. Use automated audit logs (e.g., in Power BI or Tableau) to track when metrics change.
- No clear owner for each KPI
- Solution: Assign every KPI to a named person, not just a department, before launch. Add their name and check-in frequency to your main reporting tracker so you never have to guess who owns what.
- Solution: Assign every KPI to a named person, not just a department, before launch. Add their name and check-in frequency to your main reporting tracker so you never have to guess who owns what.
- Local norms masking underperformance
- Solution: If your nearshore team comes from a high-context culture, clarify what success looks like in weekly syncs. Use visual indicators (e.g., color-coded benchmarks or emoji-based QA rubrics) to cut through ambiguity.
- Solution: If your nearshore team comes from a high-context culture, clarify what success looks like in weekly syncs. Use visual indicators (e.g., color-coded benchmarks or emoji-based QA rubrics) to cut through ambiguity.
- Lagging indicators crowding your dashboard
- Solution: Mix in leading indicators that help you course-correct faster (e.g., # of blockers per sprint, CSAT pre-triggers). Create a separate tab or widget just for predictive KPIs so they don’t get lost in the clutter.
Conclusion
You now have a complete blueprint for nearshore outsourcing KPIs that actually drive results, not just dashboards that look good in meetings. If your current setup feels messy, too manual, or hard to trust, use these KPS to reset the scorecard, fix what’s fuzzy, and make every vendor review count.
Of course, KPIs only matter if the talent behind them delivers. That’s where most teams get stuck—spending weeks screening, interviewing, and hoping for the best. At Genius, we do the brutal part for you. Our recruiters work inside local talent networks across LATAM and the Philippines, vet 250+ candidates per role, and find full-time A+ hires.
Need someone who can hit KPIs on day 1? Start hiring with Genius today.
FAQs
What are the most overlooked nearshore outsourcing KPIs?
Many teams skip tracking knowledge retention metrics, innovation contribution, or cost-to-automation gains, despite their direct impact on long-term vendor value.
How often should nearshore outsourcing KPIs be reviewed?
Weekly reviews work best for operational KPIs, while strategic metrics like ROI or innovation contribution can be evaluated monthly or quarterly.
What’s the best way to visualize nearshore outsourcing KPIs for leadership?
Use split dashboards by function via tools like Power BI or Looker Studio. Keep one view for executive summaries and another for deep-dive operational data.
Can nearshore outsourcing KPIs vary by department?
Absolutely. For example, customer support focuses on FCR and CSAT, while engineering tracks bug density and sprint velocity. There’s no one-size-fits-all set.