Scalable app architecture used to mean adding servers behind a load balancer. In 2026 it means a specific set of design choices made before the first line of production code ships. The apps that fall over on launch day are rarely the ones that ran out of CPU. They are the ones built on assumptions that stopped holding months earlier.
Below, we cover what changed for scalable app architecture in 2026, the five design pillars that keep an app upright, how to measure the architecture itself, the fixes most teams miss, and the team shape that keeps it healthy. Start with the engineering tool fragmentation context.
Why Scalable App Architecture Looks Different In 2026
The old model was a monolith on a VM behind a CDN. The 2026 model is a mesh of services, inference endpoints, and managed data stores spread across three regions. The decisions that used to live in a late-night ops ticket now live in the design doc the junior engineer reads on their first day.
The Load Curve Is No Longer A Straight Line
Traffic now spikes on a tweet, a viral video, or a model release the app depends on. The ratio between a quiet Tuesday and a peak Thursday is wider than it was in 2020. An architecture that scales linearly with revenue is already behind, because load no longer follows revenue in a predictable way.
AI Inference Is Now Part Of The Request Path
Most apps now call at least one model on the hot path of a user request. That turns the request into a dependency graph with a vendor on it, a latency variance nobody controls, and a cost per request that moves daily. Any design that treats inference as a side effect will keep failing silently.
The Five Pillars Of A Scalable App Architecture That Actually Holds
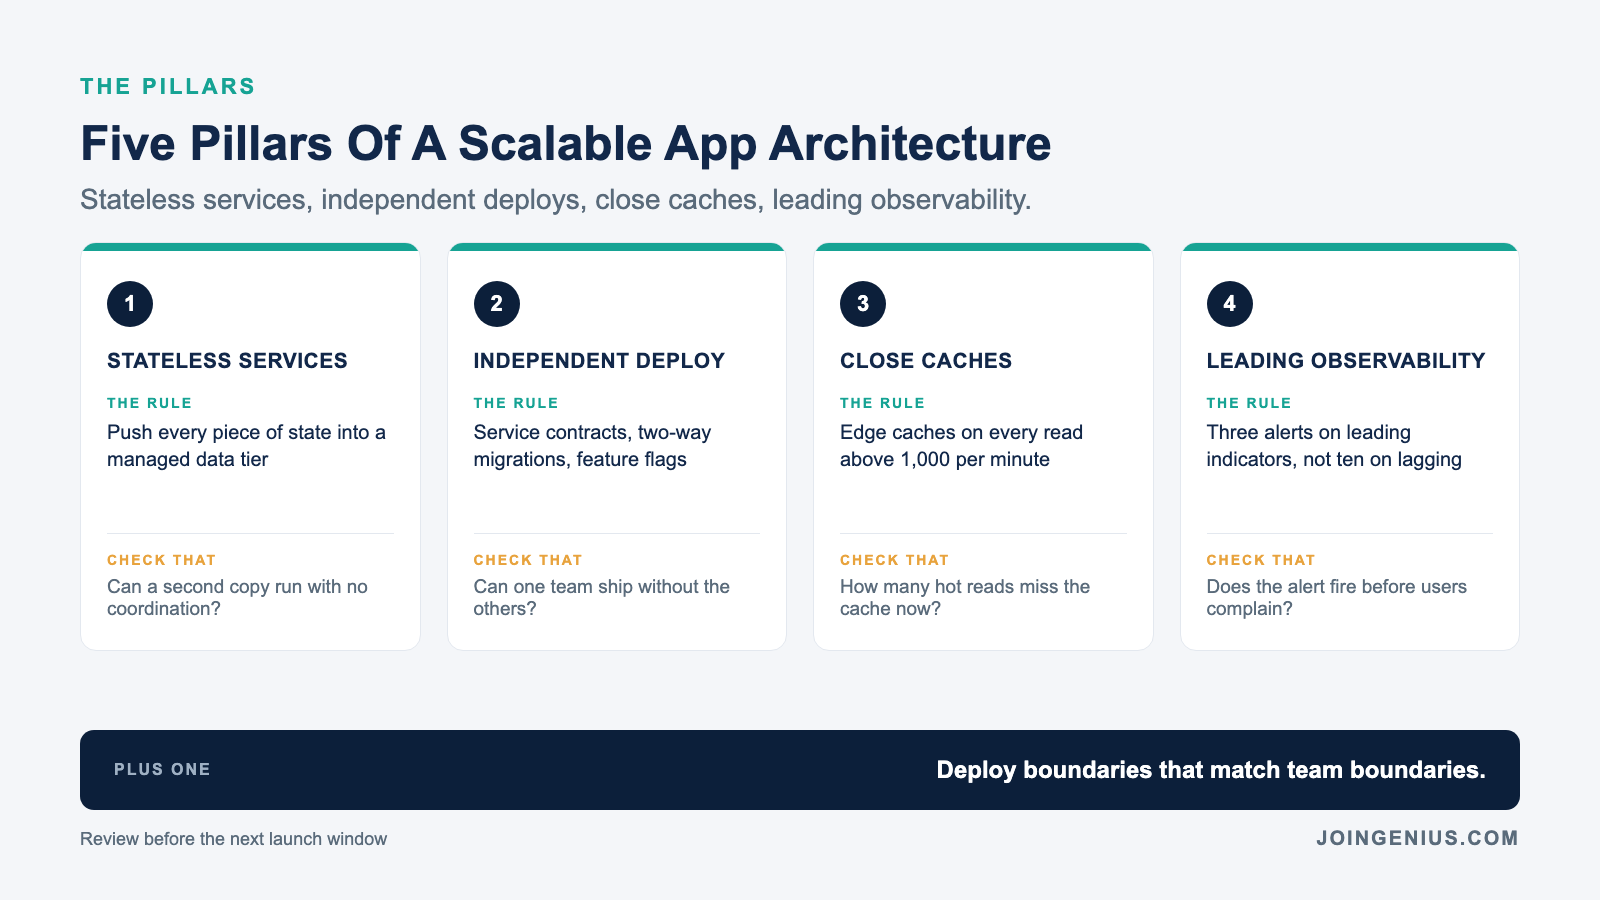
The five pillars below are what we keep finding on teams whose apps hold through a real spike. Each closes a specific class of failure. Skipping any one of them turns the system into a product that runs fine in staging and breaks in production, usually on the day the marketing team finally shipped.
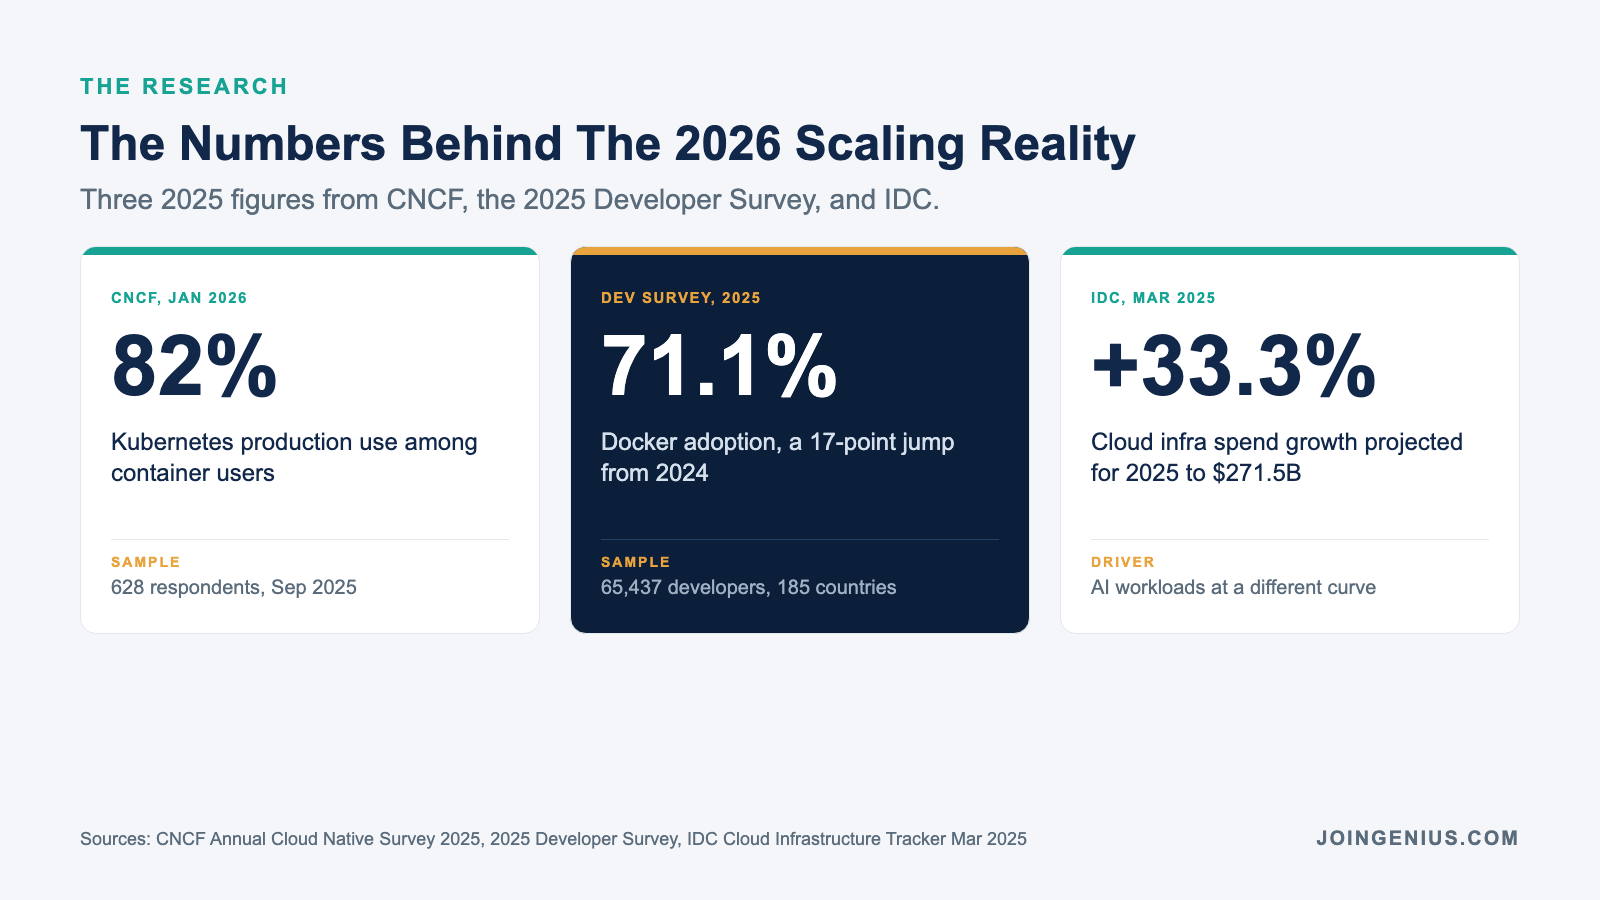
The CNCF Cloud Native Survey 2025, drawn from 628 respondents and released January 2026, put Kubernetes production use at 82% among container users, up from 66% two years earlier. The orchestration layer stopped being optional for any app expected to scale across regions.
Stateless Services And A Clean Data Boundary
A service is scalable when a second copy of it can run with no coordination. The moment a service holds state in memory, the architecture is pinned to one box. Pushing state into a managed data tier is the single highest impact design change most teams can still make.
Independent Deployability Across Every Layer
A team of four shipping twice a week beats a team of twenty shipping once a quarter. Independent deployability needs service contracts, database migrations that run both ways, and feature flags on every risky path. If a release requires a conference call, the architecture is not independent.
Caching That Lives Close To The Read
Most latency in a 2026 app is a round trip the app did not need to take. Edge caches, request-scoped memoization, and a CDN tier for static assets will cut 60 to 80 percent of the hot path on most B2C apps. See our breakdown of B2B SaaS traffic spikes for the same pattern on the enterprise side.
Observability That Fires Before Users Do
An app at scale generates more signal than any human can read. The architecture has to raise the three or four metrics that predict a failure, not the thousand that describe one. Teams that only chart CPU are watching a lagging indicator.
- Push every piece of in-memory state into a managed data tier before the next region launch.
- Count the services that cannot deploy without another one and cut that list by half this quarter.
- Place a cache in front of every read that runs more than 1,000 times a minute.
- Set three alerts on leading indicators, not ten on lagging ones.
How To Measure Whether The Architecture Is Scaling
Most engineering reports grade an architecture on uptime. That is a necessary number and almost useless on its own. The better question is whether the system is cheaper per request than last quarter and faster to change than last year. Neither shows up in a dashboard that only counts nines.
The 2025 Developer Survey, drawn from 65,437 developers across 185 countries, found Docker at 71.1% adoption, a 17-point jump from 2024 and the largest single-year rise for any technology in the survey’s history. The container has stopped being a choice.
Per IDC’s March 2025 cloud infrastructure tracker, cloud infrastructure spending is projected to grow 33.3% in 2025 to $271.5 billion, driven almost entirely by AI workloads that scale at a different curve than anything before.
Four Numbers Every Engineering Lead Should Report
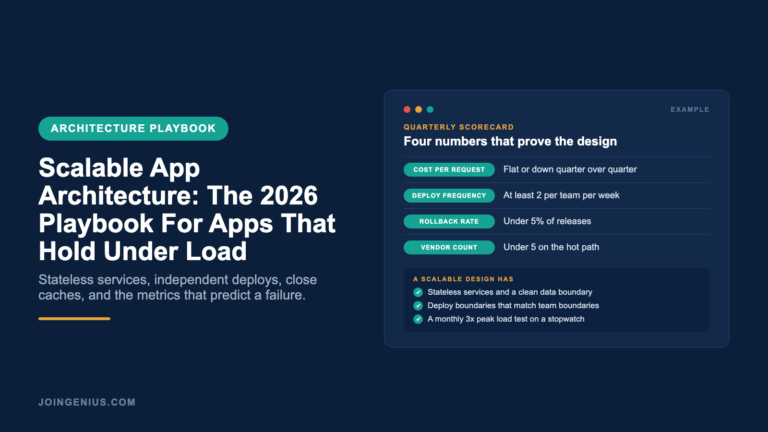
Cost per thousand requests, time from commit to production, mean time to detect a real incident, and percentage of releases that triggered a rollback. Those four describe whether the architecture is improving. Any of them moving the wrong way for two quarters means the design assumptions need a rewrite.
The Monthly Load Test That Reveals A Silent Ceiling
Run a load test once a month at 3x expected peak against a staging environment that mirrors production topology. Pair it with a trace that shows which service hit its ceiling first. The test that never fails is the one that never taught the team anything.
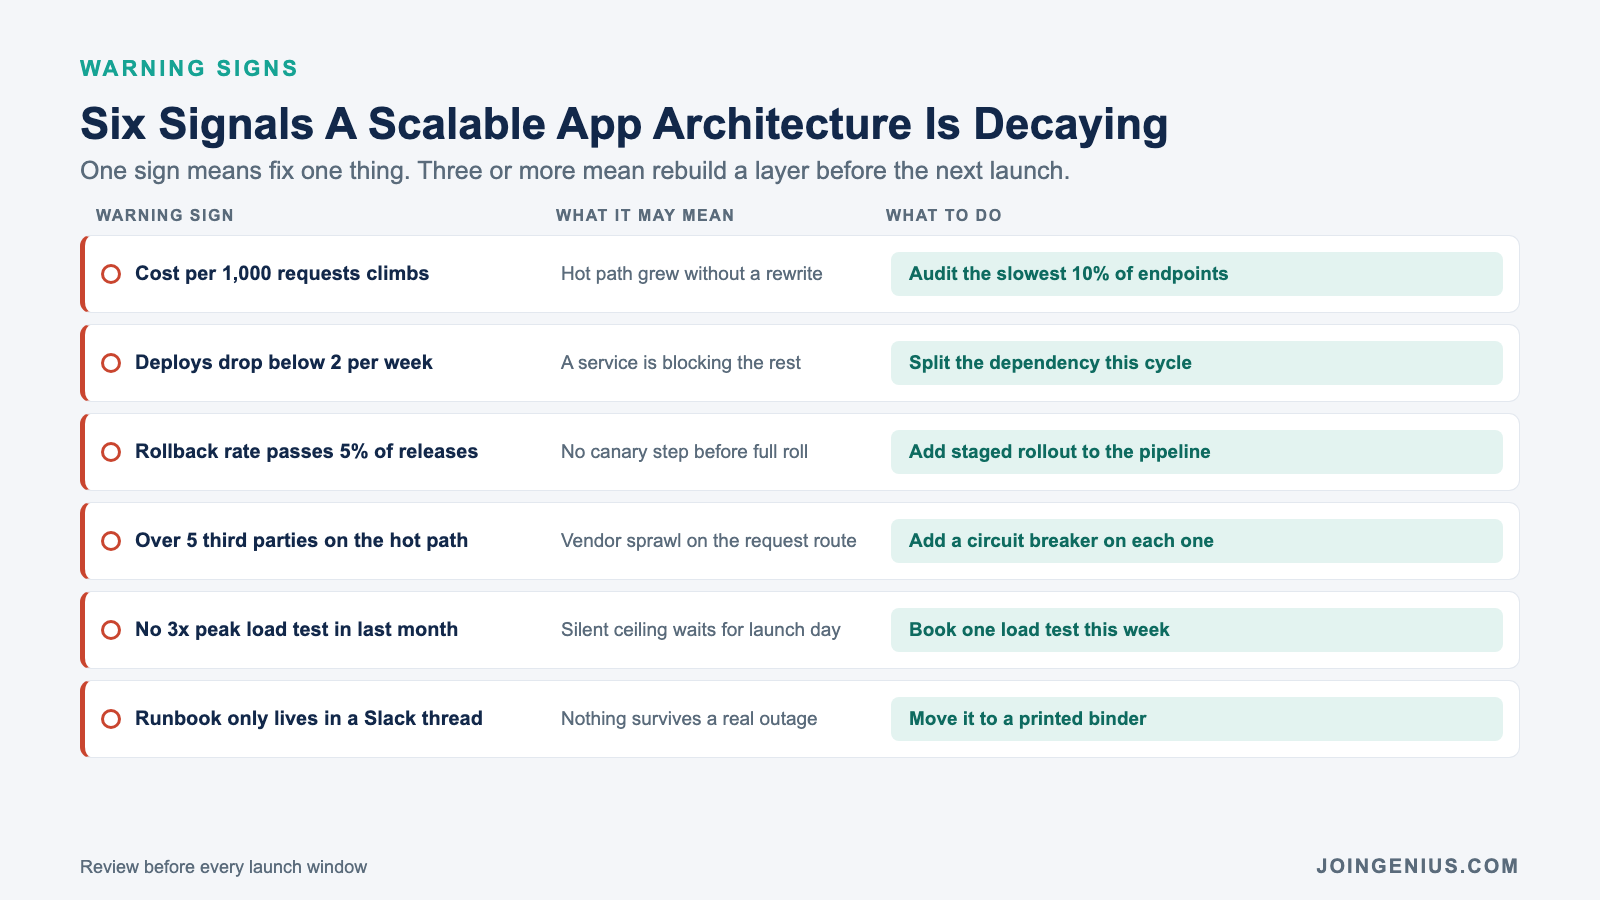
| Signal To Watch | What To Measure | Healthy Range For 2026 | What To Do If It Trips |
|---|---|---|---|
| Cost per request climbs | Infra spend per 1,000 requests | Flat or down quarter over quarter | Audit the slowest 10% of endpoints |
| Deploy frequency falls | Releases per team per week | At least 2 for a mature platform | Find the service blocking the rest |
| Rollback rate climbs | % of releases requiring a revert | Under 5% in a healthy pipeline | Add a canary step before full roll |
| Vendor dependency grows | Count of critical-path third parties | Under 5 on the request hot path | Add a circuit breaker on each one |
Any one of these slipping is a signal to fix. Three or more at once is a signal the architecture needs a rebuild on at least one layer, not another sprint of patches. Report the four numbers to the same group that reads the financials, because they compound the same way.
The Operational Fixes Most App Teams Still Miss
A scalable app architecture fails more often on operational choices than on code. The hardware is cheap, the frameworks are mature, and the patterns are documented. What is missing is usually a database access review and a deployment boundary that matches how the teams actually work.
Database Access Patterns Before Any Rewrite
Most scale problems trace to a single N+1 query, a missing index, or a read path that was never meant to serve that many users. A two week audit of the slowest 20 queries is cheaper than any microservice migration, and it closes the gap faster. See our breakdown of why transformation roadmaps fail for the same pattern.
Deployment Boundaries That Match Team Boundaries
Conway’s Law still holds. A team of six that owns one service will ship faster than the same six people spread across three services they share with other teams. The deployment boundary and the org chart have to match, or the architecture will keep leaking communication overhead into latency numbers.
Who Should Own Scalable App Architecture And When To Bring In Help
Ownership of scalable app architecture almost always goes to the wrong person on the org chart. It gets handed to the engineer who shipped the most features last quarter, who then runs a backlog of their own feature asks on top of the platform work. The architecture decays while feature velocity looks fine.
The Shape Of A Durable Platform Team
One platform lead who owns the roadmap, one SRE who owns the production runbook, one data engineer who owns the storage tier, and a quarterly sponsor from the engineering leadership team. The fifth hire is usually a developer experience engineer, not another backend generalist.
When An External Partner Or Agency Fits
An external partner fits when the in-house team cannot staff platform engineering alongside feature work. Octal Software’s scalable software solutions is one of the longer-running options for enterprises that want production-grade service boundaries built around their own code rather than a fresh rewrite. A partner that cannot show a reference restart from a real incident is not the right partner.
Conclusion
Scalable app architecture in 2026 is a set of decisions made before the first user, not a rescue mission after the first outage. The five pillars above, measured quarterly and load tested monthly, are what keep an app upright when traffic breaks the historical curve. Everything else is a patch that holds until the next spike.
Genius staffs the team shape above. We place top 1% platform leads, SREs, data engineers, and developer experience engineers from the Philippines and LATAM at 80% less than a comparable US hire, no monthly fees, every hire backed by a 6 month guarantee. If your next release needs a team that holds on a real spike, hire with Genius.